Gold prices stabilize above $4,400 as expectations for a Federal Reserve rate hike cool.
2026-08-18 02:02:56
On Monday (August 17), spot gold continued its upward trend during the US trading session. Market expectations for a rate hike at the Federal Reserve's September meeting continued to cool, putting sustained pressure on the US dollar and providing support for gold prices. Spot gold traded around $4417.69, up 0.96% on the day.  According to the CME FedWatch Tool, the market currently expects a 70% probability that the Federal Reserve will keep interest rates unchanged next month, compared to only 48% a week ago. A series of recent US economic data have fallen short of expectations, causing market expectations to shift from "rate hikes" to "a pause in rate hikes." July non-farm payrolls declined, and retail sales weakened month-on-month; both the Consumer Price Index (CPI) and Producer Price Index (PPI) saw year-on-year inflation data decline. The US Dollar Index (DXY) touched 99.30, its lowest level since June 5, before trading around 99.50. Gold is generally bullish in the short term, but bulls are reluctant to significantly push up prices. The situation in the Middle East remains a focus of market attention, especially the tensions in the Strait of Hormuz, which have pushed up oil prices, and the risk of energy-driven inflation remains. The 60-day memorandum of understanding expired without an agreement between the US and Iran. US President Trump reiterated on Monday that he would not allow Iran to acquire nuclear weapons. Meanwhile, a senior Iranian official stated that if diplomatic negotiations with the US fail, Iran will escalate tensions in the Strait of Hormuz and throughout the region. Energy-driven inflation risks persist, and the market has not completely ruled out the possibility of a rate hike later this year. Traders are awaiting the release of the July FOMC meeting minutes on Wednesday for a clearer picture of the Fed's policy path. Technical Analysis: Gold maintains a bullish trend, facing pressure as it challenges the 200-day moving average.
 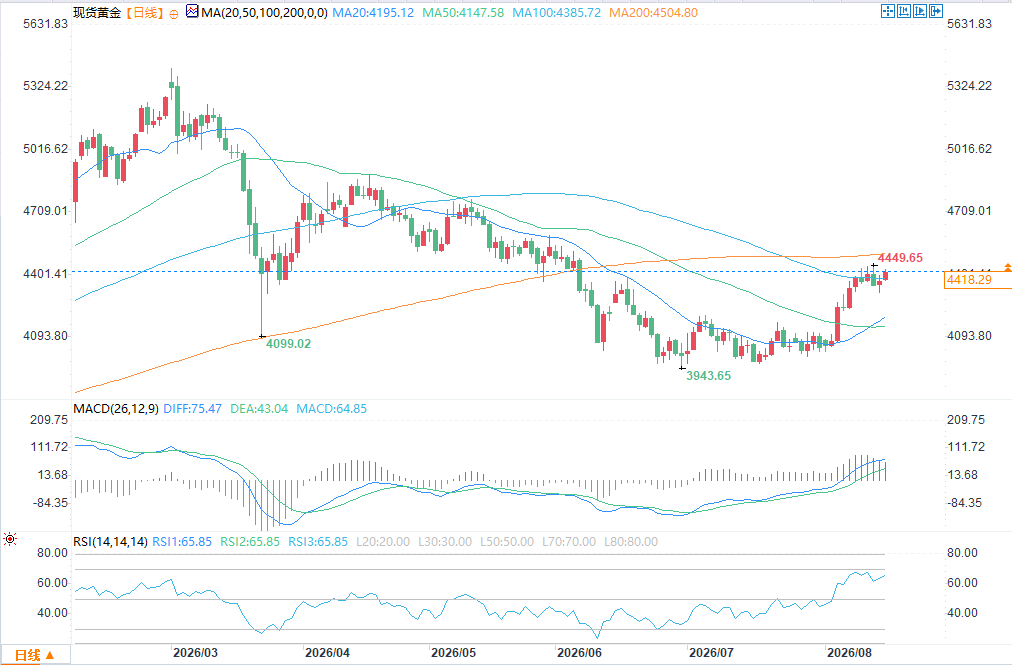 (Spot Gold Daily Chart Source: FX678) Based on the attached chart parameters: MA100 = $4385.74, MA200 = $4504.81, MA50 = $4147.60, spot gold is currently trading above the 100-day simple moving average (SMA, $4385.74), maintaining an overall bullish technical structure. The daily RSI reading is 65.91, approaching the overbought threshold of 70; the MACD indicator's DIFF and DEA are both above the zero line, with the red bars continuing to expand, indicating ample bullish momentum. However, the RSI is nearing overbought territory, requiring caution regarding the risk of a short-term pullback. Support levels: The first support level is the 100-day moving average at $4385.74; further down, there is structural buying at the $4200 psychological level, with the 50-day moving average at $4147.60; deeper key support lies at $4000. Resistance levels: The next key resistance is the 200-day simple moving average at $4504.81. This level also coincides with the upper edge of the previous trading range, making it a strong resistance; only a decisive break above this long-term moving average will open up further upside potential; if resistance is encountered here, a pullback is highly likely.
According to the CME FedWatch Tool, the market currently expects a 70% probability that the Federal Reserve will keep interest rates unchanged next month, compared to only 48% a week ago. A series of recent US economic data have fallen short of expectations, causing market expectations to shift from "rate hikes" to "a pause in rate hikes." July non-farm payrolls declined, and retail sales weakened month-on-month; both the Consumer Price Index (CPI) and Producer Price Index (PPI) saw year-on-year inflation data decline. The US Dollar Index (DXY) touched 99.30, its lowest level since June 5, before trading around 99.50. Gold is generally bullish in the short term, but bulls are reluctant to significantly push up prices. The situation in the Middle East remains a focus of market attention, especially the tensions in the Strait of Hormuz, which have pushed up oil prices, and the risk of energy-driven inflation remains. The 60-day memorandum of understanding expired without an agreement between the US and Iran. US President Trump reiterated on Monday that he would not allow Iran to acquire nuclear weapons. Meanwhile, a senior Iranian official stated that if diplomatic negotiations with the US fail, Iran will escalate tensions in the Strait of Hormuz and throughout the region. Energy-driven inflation risks persist, and the market has not completely ruled out the possibility of a rate hike later this year. Traders are awaiting the release of the July FOMC meeting minutes on Wednesday for a clearer picture of the Fed's policy path. Technical Analysis: Gold maintains a bullish trend, facing pressure as it challenges the 200-day moving average. (Spot Gold Daily Chart Source: FX678) Based on the attached chart parameters: MA100 = $4385.74, MA200 = $4504.81, MA50 = $4147.60, spot gold is currently trading above the 100-day simple moving average (SMA, $4385.74), maintaining an overall bullish technical structure. The daily RSI reading is 65.91, approaching the overbought threshold of 70; the MACD indicator's DIFF and DEA are both above the zero line, with the red bars continuing to expand, indicating ample bullish momentum. However, the RSI is nearing overbought territory, requiring caution regarding the risk of a short-term pullback. Support levels: The first support level is the 100-day moving average at $4385.74; further down, there is structural buying at the $4200 psychological level, with the 50-day moving average at $4147.60; deeper key support lies at $4000. Resistance levels: The next key resistance is the 200-day simple moving average at $4504.81. This level also coincides with the upper edge of the previous trading range, making it a strong resistance; only a decisive break above this long-term moving average will open up further upside potential; if resistance is encountered here, a pullback is highly likely.- Risk Warning and Disclaimer
- The market involves risk, and trading may not be suitable for all investors. This article is for reference only and does not constitute personal investment advice, nor does it take into account certain users’ specific investment objectives, financial situation, or other needs. Any investment decisions made based on this information are at your own risk.