ETF funds are flowing back into gold, but what's truly alarming is another market signal.
2026-08-18 20:28:58
On Tuesday, August 18th, spot gold was fluctuating around $4390 per ounce, down about 0.5% on the day. Gold has risen approximately 9.5% over the past month, but the core contradiction in the market has shifted: the US dollar index is hovering around 99.6, down about 1.3% from the past month, while global long-term government bond yields are rising in tandem, with the US 30-year Treasury yield reaching around 5.3%, its highest level since 2007. In other words, gold is facing an atypical macroeconomic combination: a weaker dollar and cooling interest rate expectations are providing a buffer, but long-term real financing costs, energy prices, and fiscal risk premiums are continuing to rise. At the July 28-29 policy meeting, the Federal Reserve maintained the target range for the federal funds rate at 3.50% to 3.75%, with a 9-3 vote, the three members favoring a 25 basis point rate hike. This indicates that the policymakers' assessment of inflation risks is not entirely consistent. The minutes of the July meeting will be released on August 19, so the market's focus is not simply on whether interest rates will be adjusted at the next meeting, but on how the committee describes the relationship between inflation stickiness, slowing demand, and financial conditions.  More noteworthy is the growing decoupling between short-term policy expectations and long-term bond yields. Recently, the yield on the 30-year US Treasury note rose to approximately 5.3%, while the 10-year yield remained above 4.7%, indicating that long-term financing costs have not decreased in tandem with the market's weakening pricing of recent interest rate hikes. This structure suggests that the rise in long-term interest rates cannot be entirely attributed to further monetary tightening. Term premiums, fiscal financing scale, inflation risk compensation, and bond supply pressures are gaining greater weight. This is particularly important for gold. Traditional models typically assume that rising yields mean increased opportunity costs for non-interest-bearing assets, but if the rise in yields is primarily due to fiscal sustainability and term risk repricing, the previously stable negative correlation between gold and long-term yields may weaken. This is not an anomaly in a single bond market. The yield on German 10-year government bonds rose to approximately 3.25% to 3.27%, near its highest level since 2011; the yield on Japanese 10-year government bonds approached 2.95%, reaching a roughly 30-year high; and French long-term financing costs also rose to multi-year highs. The simultaneous pressure on global long-term bonds indicates that the market is again demanding higher long-term risk compensation. This is not entirely the same as typical overheated economic trading. Currently, the factors driving up long-term yields include at least three layers: first, inflation risk compensation triggered by renewed increases in energy costs; second, increased fiscal financing demand and bond supply; and third, investors demanding higher returns for long-term holdings of assets with longer durations. Therefore, the recent simultaneous pressure or significant fluctuations in gold and bonds are not logically contradictory. Gold does not mechanically react to nominal yields; it is truly sensitive to the combined effects of real interest rates, the US dollar, liquidity, fiscal credit risk, and safe-haven demand. The situation in the Middle East has once again become a significant transmission variable between interest rates and precious metals. Shipping in the Strait of Hormuz continues to be disrupted, with another ship attack on August 18th, and Brent crude oil had already risen above $90 per barrel. Energy supply risks first affect inflation expectations, then transmit to gold through bond term premiums and monetary policy expectations. This is also the area most easily misinterpreted in the current market. Geopolitical risks do not necessarily manifest directly as unilateral changes in gold prices. If the conflict initially drives up energy prices, the bond market may increase inflation compensation, leading to a rise in long-term yields; simultaneously, demand for safe-haven assets may increase. These two forces are moving in opposite directions, therefore gold price performance depends on which factor—the US dollar, real interest rates, or capital flows—is dominating. Funding data already shows some changes in allocation. Global gold ETFs recorded a net inflow of approximately $3 billion in July, ending two consecutive months of net outflows, with holdings increasing by 23 tons to 4068 tons, and assets under management rising to approximately $530 billion. This indicates that the recent recovery in gold prices is not entirely due to short-term derivatives trading; some medium- to long-term allocation funds have also re-entered the market. Looking at the daily chart, spot gold has undergone a significant recovery after reaching a low near 3959.56, currently trading above the Bollinger Middle Band at 4169.39 and approaching the Upper Band at 4479.64. The recent local high was 4449.65, indicating that the price has entered a high-level fluctuation zone after the previous rise.
 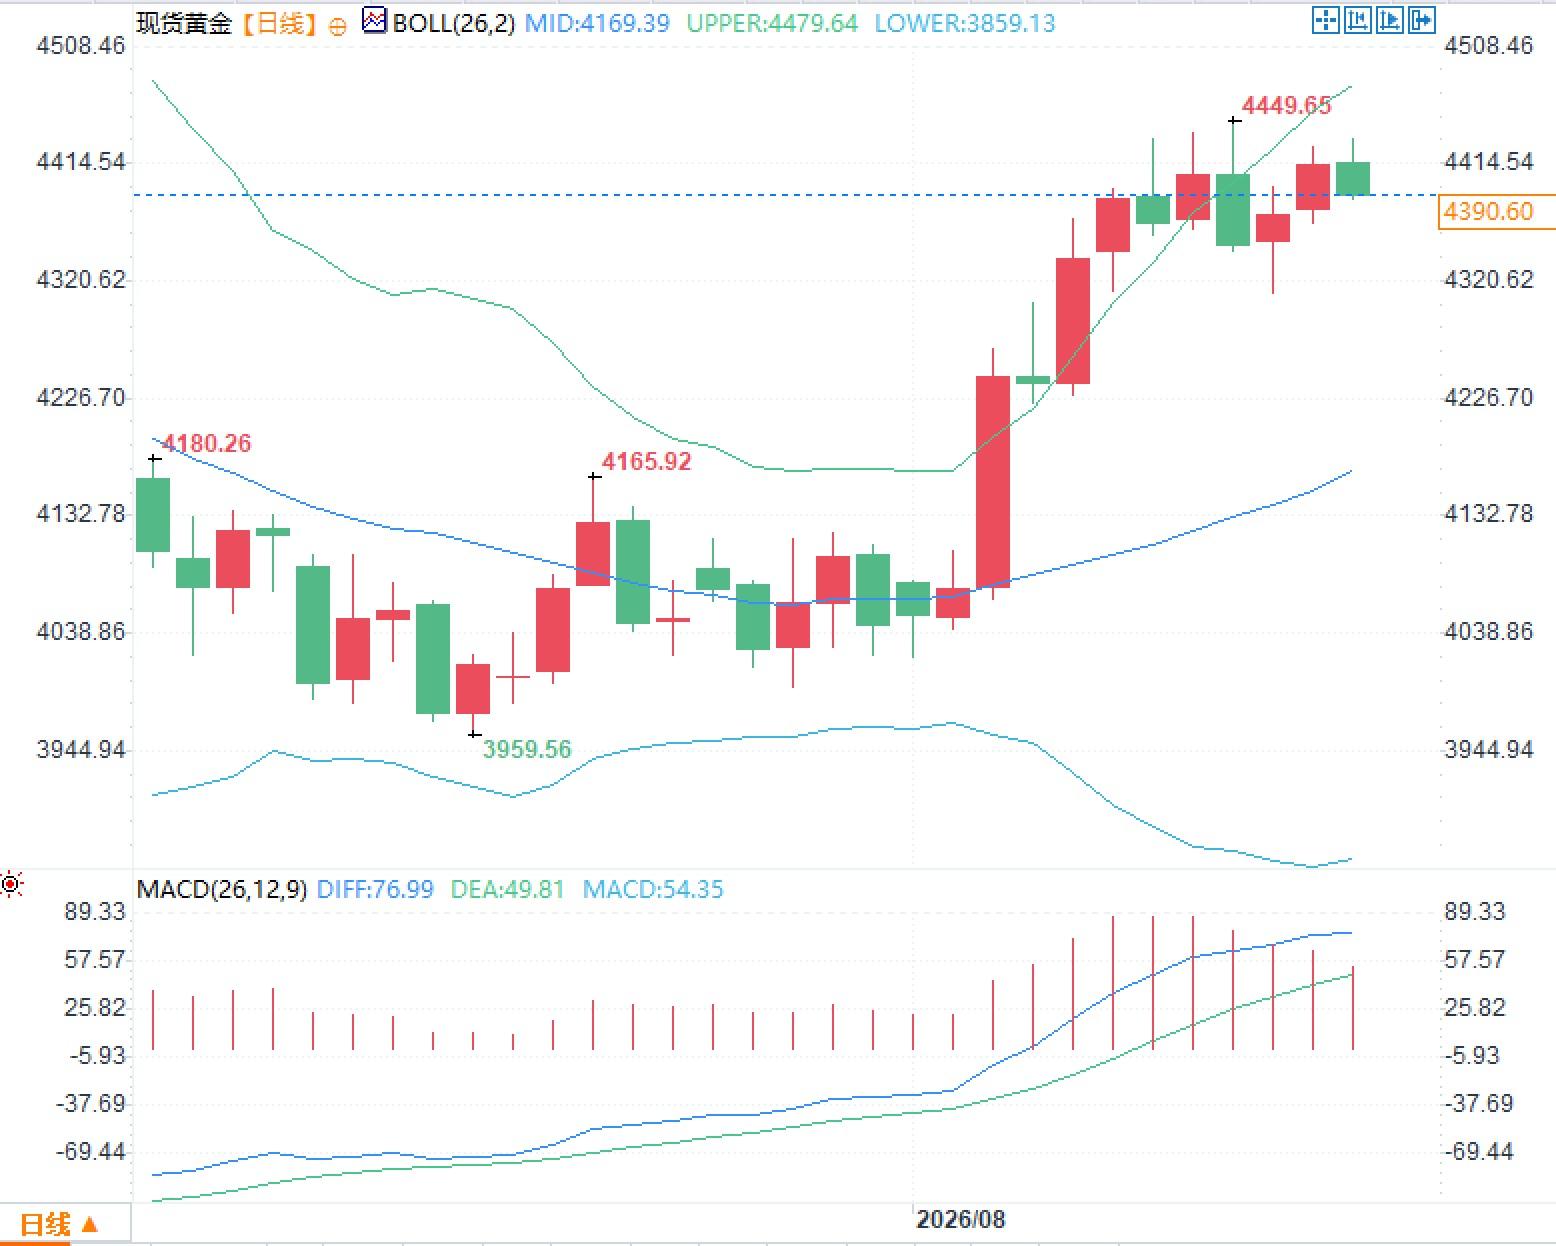 MACD data shows the DIF at 76.99 and the DEA at 49.81, both above the zero line, with the histogram remaining positive. This confirms that the previous price correction was accompanied by improved medium-term momentum, but it cannot directly predict the next phase's direction, especially given that prices are near the upper Bollinger Band, long-term interest rates are changing rapidly, and significant policy announcements are imminent. It's also worth noting that the Bollinger Bands have expanded again after previously narrowing, indicating that the market has moved from a low-volatility consolidation phase to a more volatile environment.
More noteworthy is the growing decoupling between short-term policy expectations and long-term bond yields. Recently, the yield on the 30-year US Treasury note rose to approximately 5.3%, while the 10-year yield remained above 4.7%, indicating that long-term financing costs have not decreased in tandem with the market's weakening pricing of recent interest rate hikes. This structure suggests that the rise in long-term interest rates cannot be entirely attributed to further monetary tightening. Term premiums, fiscal financing scale, inflation risk compensation, and bond supply pressures are gaining greater weight. This is particularly important for gold. Traditional models typically assume that rising yields mean increased opportunity costs for non-interest-bearing assets, but if the rise in yields is primarily due to fiscal sustainability and term risk repricing, the previously stable negative correlation between gold and long-term yields may weaken. This is not an anomaly in a single bond market. The yield on German 10-year government bonds rose to approximately 3.25% to 3.27%, near its highest level since 2011; the yield on Japanese 10-year government bonds approached 2.95%, reaching a roughly 30-year high; and French long-term financing costs also rose to multi-year highs. The simultaneous pressure on global long-term bonds indicates that the market is again demanding higher long-term risk compensation. This is not entirely the same as typical overheated economic trading. Currently, the factors driving up long-term yields include at least three layers: first, inflation risk compensation triggered by renewed increases in energy costs; second, increased fiscal financing demand and bond supply; and third, investors demanding higher returns for long-term holdings of assets with longer durations. Therefore, the recent simultaneous pressure or significant fluctuations in gold and bonds are not logically contradictory. Gold does not mechanically react to nominal yields; it is truly sensitive to the combined effects of real interest rates, the US dollar, liquidity, fiscal credit risk, and safe-haven demand. The situation in the Middle East has once again become a significant transmission variable between interest rates and precious metals. Shipping in the Strait of Hormuz continues to be disrupted, with another ship attack on August 18th, and Brent crude oil had already risen above $90 per barrel. Energy supply risks first affect inflation expectations, then transmit to gold through bond term premiums and monetary policy expectations. This is also the area most easily misinterpreted in the current market. Geopolitical risks do not necessarily manifest directly as unilateral changes in gold prices. If the conflict initially drives up energy prices, the bond market may increase inflation compensation, leading to a rise in long-term yields; simultaneously, demand for safe-haven assets may increase. These two forces are moving in opposite directions, therefore gold price performance depends on which factor—the US dollar, real interest rates, or capital flows—is dominating. Funding data already shows some changes in allocation. Global gold ETFs recorded a net inflow of approximately $3 billion in July, ending two consecutive months of net outflows, with holdings increasing by 23 tons to 4068 tons, and assets under management rising to approximately $530 billion. This indicates that the recent recovery in gold prices is not entirely due to short-term derivatives trading; some medium- to long-term allocation funds have also re-entered the market. Looking at the daily chart, spot gold has undergone a significant recovery after reaching a low near 3959.56, currently trading above the Bollinger Middle Band at 4169.39 and approaching the Upper Band at 4479.64. The recent local high was 4449.65, indicating that the price has entered a high-level fluctuation zone after the previous rise. MACD data shows the DIF at 76.99 and the DEA at 49.81, both above the zero line, with the histogram remaining positive. This confirms that the previous price correction was accompanied by improved medium-term momentum, but it cannot directly predict the next phase's direction, especially given that prices are near the upper Bollinger Band, long-term interest rates are changing rapidly, and significant policy announcements are imminent. It's also worth noting that the Bollinger Bands have expanded again after previously narrowing, indicating that the market has moved from a low-volatility consolidation phase to a more volatile environment.
- Risk Warning and Disclaimer
- The market involves risk, and trading may not be suitable for all investors. This article is for reference only and does not constitute personal investment advice, nor does it take into account certain users’ specific investment objectives, financial situation, or other needs. Any investment decisions made based on this information are at your own risk.