What happened in the copper market after a sudden reversal of 42 consecutive trading days of inventory reduction?
2026-08-19 18:00:57
On Wednesday, August 19th, the most noteworthy variable in the copper market shifted from simple absolute prices to the rapid recovery of inventory deliverability and the term structure. Currently, three-month copper on the London Metal Exchange is trading around $13,880 per tonne, down about 0.5% on the day, following a 1.2% drop in the previous trading day; this indicates that inventory changes are directly impacting near-term pricing. Meanwhile, the most crucial change occurred on the warehouse receipt side. Registered warehouse receipts available for buyer withdrawal increased by over 35,000 tons in a single day, with over 20,000 tons of copper entering warehouses the previous day. For comparison, total copper inventory on the exchange was 223,550 tons on August 18th, 207,825 tons on August 17th, and nearly 389,425 tons at the end of May. In other words, this round of inventory repatriation did not occur in an environment of absolute inventory abundance, but rather suddenly appeared after several weeks of continuous destocking, thus its marginal impact on the term structure is significantly higher than that of typical restocking.  The anomaly in the market earlier this round was not just the rise in copper prices, but the rapid decline in the number of warehouse receipts that could be immediately used for fulfillment. At the end of July, total exchange inventory was still 249,850 tons, but by August 14th it had fallen to 204,975 tons, declining for 42 consecutive trading days. At the same time, a large amount of inventory had already entered the cancellation process, meaning that although these metals were still within the warehouse statistics system, they were awaiting retrieval and could not freely fulfill the function of futures delivery like normally registered warehouse receipts. Therefore, when analyzing a single-day increase of 35,000 tons in inventory, the focus should not only be on the total tonnage, but also on how much of the newly added metal actually became valid registered warehouse receipts. An increase in registered warehouse receipts is equivalent to expanding the supply pool that can directly enter the delivery system, and its impact on near-month contracts is usually far greater than its impact on the supply and demand balance of far-month contracts. This is why, after inventory returns, the price adjustment magnitude is not the most important data; the term spread is more informative. The high spot premium paid by the market in the early stages is essentially a time value, meaning the market is willing to pay extra costs to immediately obtain metal. When deliverable inventory recovers, this scarcity premium is the first to be repriced. This week saw extreme conditions in the near-term structure. On August 17th, the spot premium over three-month copper reached a high of around $543.50 per ton, a level rarely seen since 2021; subsequently, with an increase in warehouse receipts, the latest spot premium over three-month copper has fallen back to around $207 per ton. It is important to emphasize that a narrowing premium does not equate to a sudden deterioration in demand in the traditional sense. The term structure reflects the availability of metals on a specific date. When traders face near-month delivery obligations but struggle to find registrable metal in a timely manner, near-month prices can deviate significantly from distant fundamentals, forming a premium. Once physical metals re-enter warehouses, this term mismatch can quickly ease. This distinction is crucial from a market microstructure perspective. Absolute prices answer how copper is valued overall, while term spreads answer how much additional cost the market is willing to pay for "owning copper today" rather than "owning copper months later." The most dramatic recent changes have clearly focused on the latter. The previous continuous decline in London inventories was directly linked to the regional price differences formed in the US market. US refined copper imports exceeded 200,000 tons in July, a 12-year high, with cross-market price differentials causing a large amount of tradable metal to shift to the US storage system. Meanwhile, available London inventories continued to shrink, ultimately pushing the spot premium to an abnormal level. The problem is that arbitrage trading can change the location of metals, but it doesn't create them out of thin air. When a market consistently offers higher net returns, traders will move their inventory to that market; when price differentials, transportation costs, storage fees, capital costs, and policy expectations change, some metals re-entering the London registry also aligns with arbitrage logic. Therefore, this sudden increase in inventories is more like a temporary reverse flow in the previous cross-market inventory reallocation process. Its significance lies in the fact that the previously extremely tight "location mismatch" and "maturity mismatch" in the market are being corrected, but this is a different issue from whether the long-term supply at the global mining and smelting ends is ample. Looking at the daily chart, the Bollinger Band middle line is approximately 13870.48, the upper line is approximately 14322.36, and the lower line is approximately 13418.61. Copper prices had previously touched around 14396 before quickly returning to the Bollinger middle band area, indicating that short-term prices have moved from the high volatility near the upper band back to the vicinity of the middle band.
 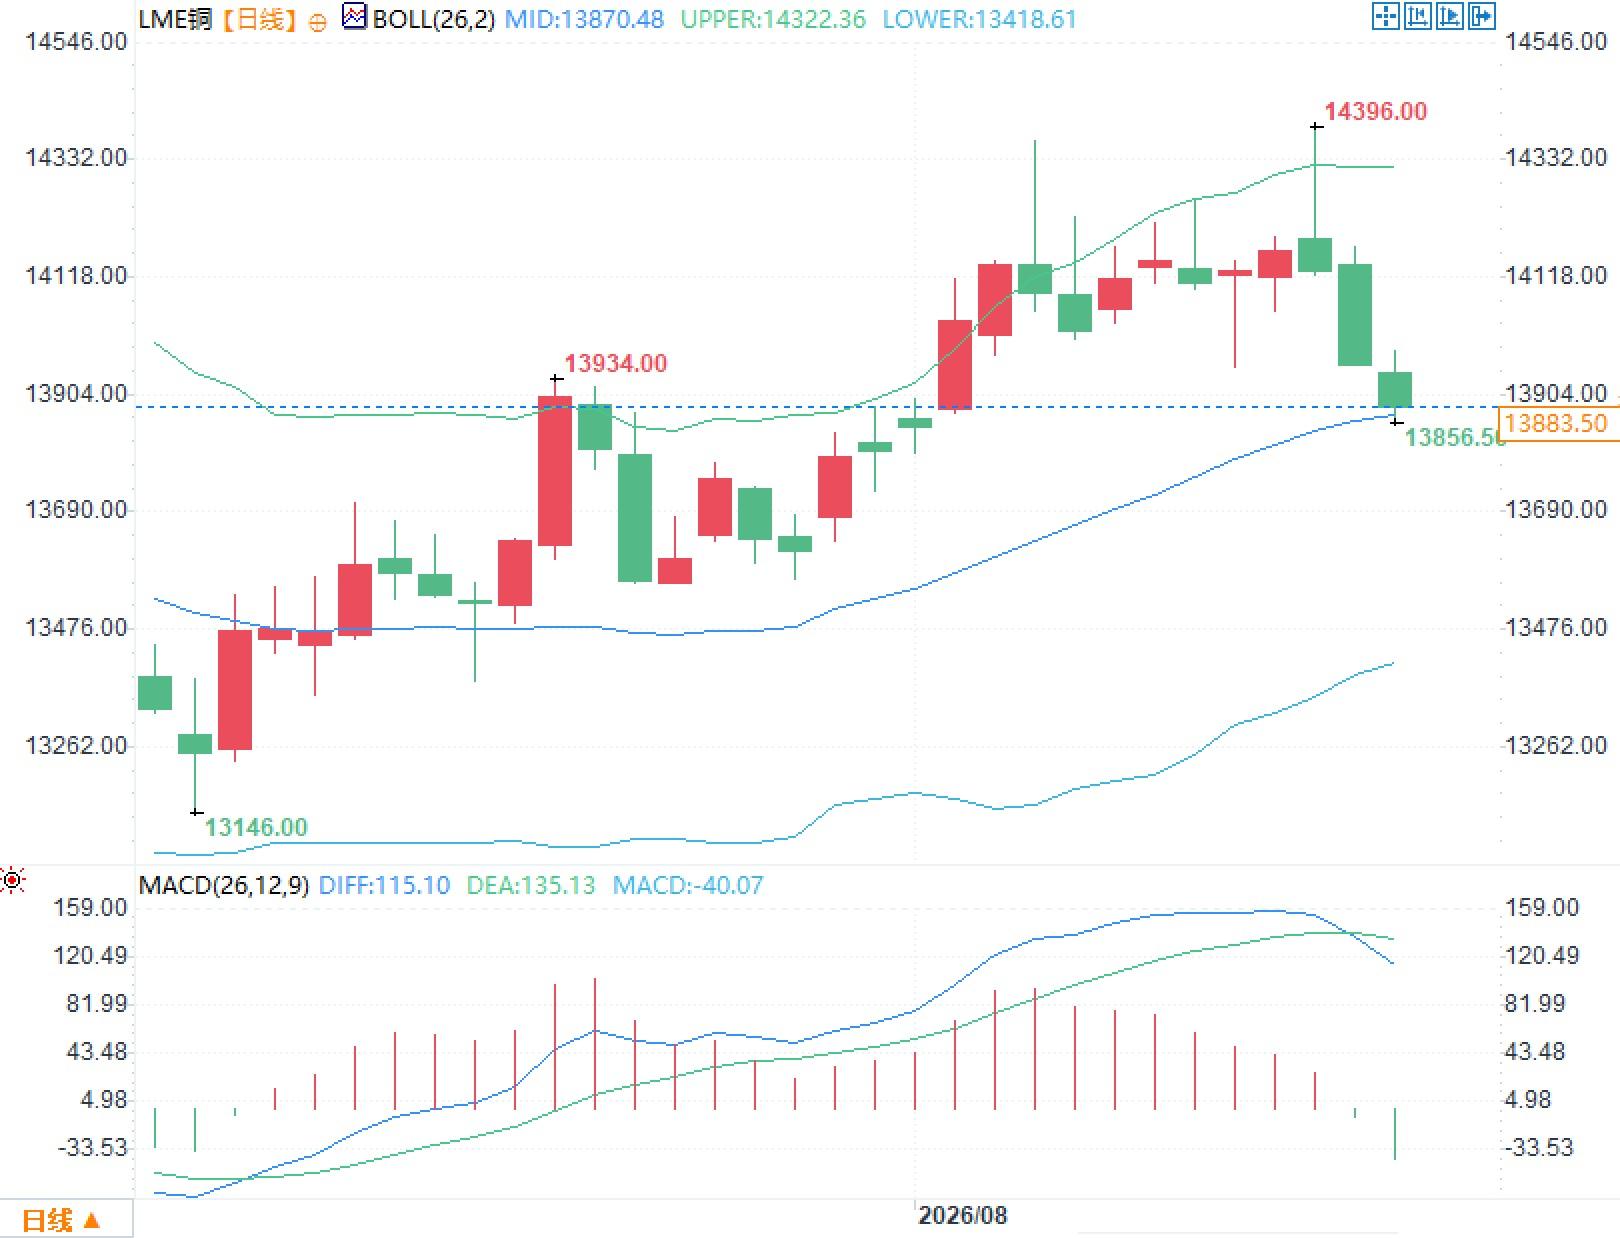 Regarding the MACD, the DIFF is approximately 115.10, the DEA is approximately 135.13, and the histogram value is approximately -40.07. Its core meaning is not to provide a directional signal, but rather to indicate that after a rapid price increase, the short-term momentum has fallen below the smoothed-out medium-term momentum.
The anomaly in the market earlier this round was not just the rise in copper prices, but the rapid decline in the number of warehouse receipts that could be immediately used for fulfillment. At the end of July, total exchange inventory was still 249,850 tons, but by August 14th it had fallen to 204,975 tons, declining for 42 consecutive trading days. At the same time, a large amount of inventory had already entered the cancellation process, meaning that although these metals were still within the warehouse statistics system, they were awaiting retrieval and could not freely fulfill the function of futures delivery like normally registered warehouse receipts. Therefore, when analyzing a single-day increase of 35,000 tons in inventory, the focus should not only be on the total tonnage, but also on how much of the newly added metal actually became valid registered warehouse receipts. An increase in registered warehouse receipts is equivalent to expanding the supply pool that can directly enter the delivery system, and its impact on near-month contracts is usually far greater than its impact on the supply and demand balance of far-month contracts. This is why, after inventory returns, the price adjustment magnitude is not the most important data; the term spread is more informative. The high spot premium paid by the market in the early stages is essentially a time value, meaning the market is willing to pay extra costs to immediately obtain metal. When deliverable inventory recovers, this scarcity premium is the first to be repriced. This week saw extreme conditions in the near-term structure. On August 17th, the spot premium over three-month copper reached a high of around $543.50 per ton, a level rarely seen since 2021; subsequently, with an increase in warehouse receipts, the latest spot premium over three-month copper has fallen back to around $207 per ton. It is important to emphasize that a narrowing premium does not equate to a sudden deterioration in demand in the traditional sense. The term structure reflects the availability of metals on a specific date. When traders face near-month delivery obligations but struggle to find registrable metal in a timely manner, near-month prices can deviate significantly from distant fundamentals, forming a premium. Once physical metals re-enter warehouses, this term mismatch can quickly ease. This distinction is crucial from a market microstructure perspective. Absolute prices answer how copper is valued overall, while term spreads answer how much additional cost the market is willing to pay for "owning copper today" rather than "owning copper months later." The most dramatic recent changes have clearly focused on the latter. The previous continuous decline in London inventories was directly linked to the regional price differences formed in the US market. US refined copper imports exceeded 200,000 tons in July, a 12-year high, with cross-market price differentials causing a large amount of tradable metal to shift to the US storage system. Meanwhile, available London inventories continued to shrink, ultimately pushing the spot premium to an abnormal level. The problem is that arbitrage trading can change the location of metals, but it doesn't create them out of thin air. When a market consistently offers higher net returns, traders will move their inventory to that market; when price differentials, transportation costs, storage fees, capital costs, and policy expectations change, some metals re-entering the London registry also aligns with arbitrage logic. Therefore, this sudden increase in inventories is more like a temporary reverse flow in the previous cross-market inventory reallocation process. Its significance lies in the fact that the previously extremely tight "location mismatch" and "maturity mismatch" in the market are being corrected, but this is a different issue from whether the long-term supply at the global mining and smelting ends is ample. Looking at the daily chart, the Bollinger Band middle line is approximately 13870.48, the upper line is approximately 14322.36, and the lower line is approximately 13418.61. Copper prices had previously touched around 14396 before quickly returning to the Bollinger middle band area, indicating that short-term prices have moved from the high volatility near the upper band back to the vicinity of the middle band. Regarding the MACD, the DIFF is approximately 115.10, the DEA is approximately 135.13, and the histogram value is approximately -40.07. Its core meaning is not to provide a directional signal, but rather to indicate that after a rapid price increase, the short-term momentum has fallen below the smoothed-out medium-term momentum.
- Risk Warning and Disclaimer
- The market involves risk, and trading may not be suitable for all investors. This article is for reference only and does not constitute personal investment advice, nor does it take into account certain users’ specific investment objectives, financial situation, or other needs. Any investment decisions made based on this information are at your own risk.