After gold surged 4% overnight: what really changed the market may not be risk aversion sentiment.
2026-08-20 20:30:58
On Thursday, August 20th, spot gold entered a period of high-level consolidation after experiencing its most significant single-day gain in six months in the previous trading session. Market data shows that spot gold rose to around $4527 per ounce at one point, and has currently retreated to around $4460 per ounce, after a gain of over 4% in the previous trading day. This round of price fluctuations was not driven by a single safe-haven factor, but rather by the combined effects of a rapid decline in long-term Treasury yields, a weakening dollar, a repricing of fiscal risk premiums, and policy disagreements within the Federal Reserve. Data shows that the 10-year Treasury yield had previously fallen to approximately 4.65%, and the 30-year yield had dropped from near its highest level since 2007 to approximately 5.20%, directly altering the real interest rate environment for gold. It is worth noting that the current trading logic for gold has shifted from traditional simple interest rate trading to a multi-factor framework dominated by fiscal, monetary, inflation, and term premiums. What truly needs to be observed now is not single-day price fluctuations, but whether there has been a structural change in the correlation between gold and long-term yields, the dollar, and energy prices. The direct trigger for this round of sharp gold price fluctuations was the US Treasury's unexpected expansion of its long-term Treasury bond repurchase program. According to the latest arrangements, the upper limit for a single liquidity support repurchase agreement (repo) for longer-term Treasury bonds will be increased from $2 billion to at least $4 billion, effective September 9. The total new repo volume for the entire quarter will reach at least $14 billion. While this figure is not enormous relative to the vast stock of Treasury bonds, its market significance is significantly greater than its absolute size.  The reason lies in the fact that one of the core variables in gold trading is not the nominal interest rate itself, but the opportunity cost of holding a non-interest-bearing asset. When the 30-year Treasury yield previously rose to around 5.3%, the high yield imposed a significant valuation constraint on gold. However, after the repurchase policy was announced, the 30-year yield fell by about 7 basis points in a single day, and the 10-year yield fell by about 6 basis points simultaneously, thus giving gold a rapid repricing space. But there is a detail that is easily overlooked here. The fiscal authorities can improve bond market liquidity through repurchase agreements, but they cannot directly eliminate the problems of increased long-term Treasury bond supply, fiscal deficits, and rising term premiums. Therefore, this round of policy is closer to micro-structural adjustments in the market than traditional monetary easing. The strong reaction of gold to this essentially indicates that the market is reassessing the impact of long-term fiscal risks on currency purchasing power and asset allocation frameworks. The most complex aspect of gold at present is that interest rate factors have not formed a one-way driving force. The Federal Reserve maintained the target range for the federal funds rate at 3.50% to 3.75% at its July meeting, but the latest meeting minutes show that three policymakers supported a 25 basis point rate hike, while more officials believed that further tightening might be necessary if inflation did not continue to decline. This means that the market's previous understanding of the policy path needs to be recalibrated. For gold, this creates a clear contradiction. On the one hand, the Treasury's expansion of long-term bond repurchase agreements is suppressing long-term yields, while the dollar's temporary weakness is reducing the opportunity cost of gold; on the other hand, high energy prices are increasing inflation stickiness again, and if inflationary pressures persist, the Fed's ability to maintain high interest rates or even discuss further tightening may be prolonged. This is why gold did not continue its upward trend after a rapid rise of over 4%. The market is actually trading two themes simultaneously: long-term fiscal and monetary purchasing power risks, and the risk of a short-term resurgence in real interest rates. From an asset pricing perspective, this combination usually means that gold volatility may be significantly higher than during a simple rate-cutting phase, because each round of changes in energy prices, inflation data, and bond yields can alter the relative weights of the two pricing logics. Recent changes in the energy market are particularly noteworthy. Conflicts in the Middle East have re-entered the pricing system with concerns about crude oil supply, and rising oil prices simultaneously affect two core variables for gold. The first path is safe-haven demand. When regional uncertainty increases, gold typically gains a risk premium. The second path is entirely different: rising energy prices transmit to inflation through transportation, manufacturing, and consumer costs, strengthening the Federal Reserve's rationale for maintaining restrictive policies. Therefore, the current rise in oil prices is not a traditional one-way benefit for gold. The short-term safe-haven premium and medium-term inflationary interest rate pressures actually hedge against each other. This also explains why the market's sensitivity to bond yields has increased significantly recently. What's truly worth observing is not how much oil prices rise alone, but whether changes in energy prices ultimately drive up nominal yields or down real yields. If inflation expectations rise faster than nominal interest rates, the real interest rate environment for gold will change drastically. Looking at the daily chart, the Bollinger Bands' middle band is approximately $4200.84/oz, the upper band is approximately $4545/oz, and the lower band is approximately $3856.68/oz. After a rapid rise, gold has moved to the upper Bollinger Band area, and the Bollinger Bands have widened again, indicating a significant increase in volatility recently.
 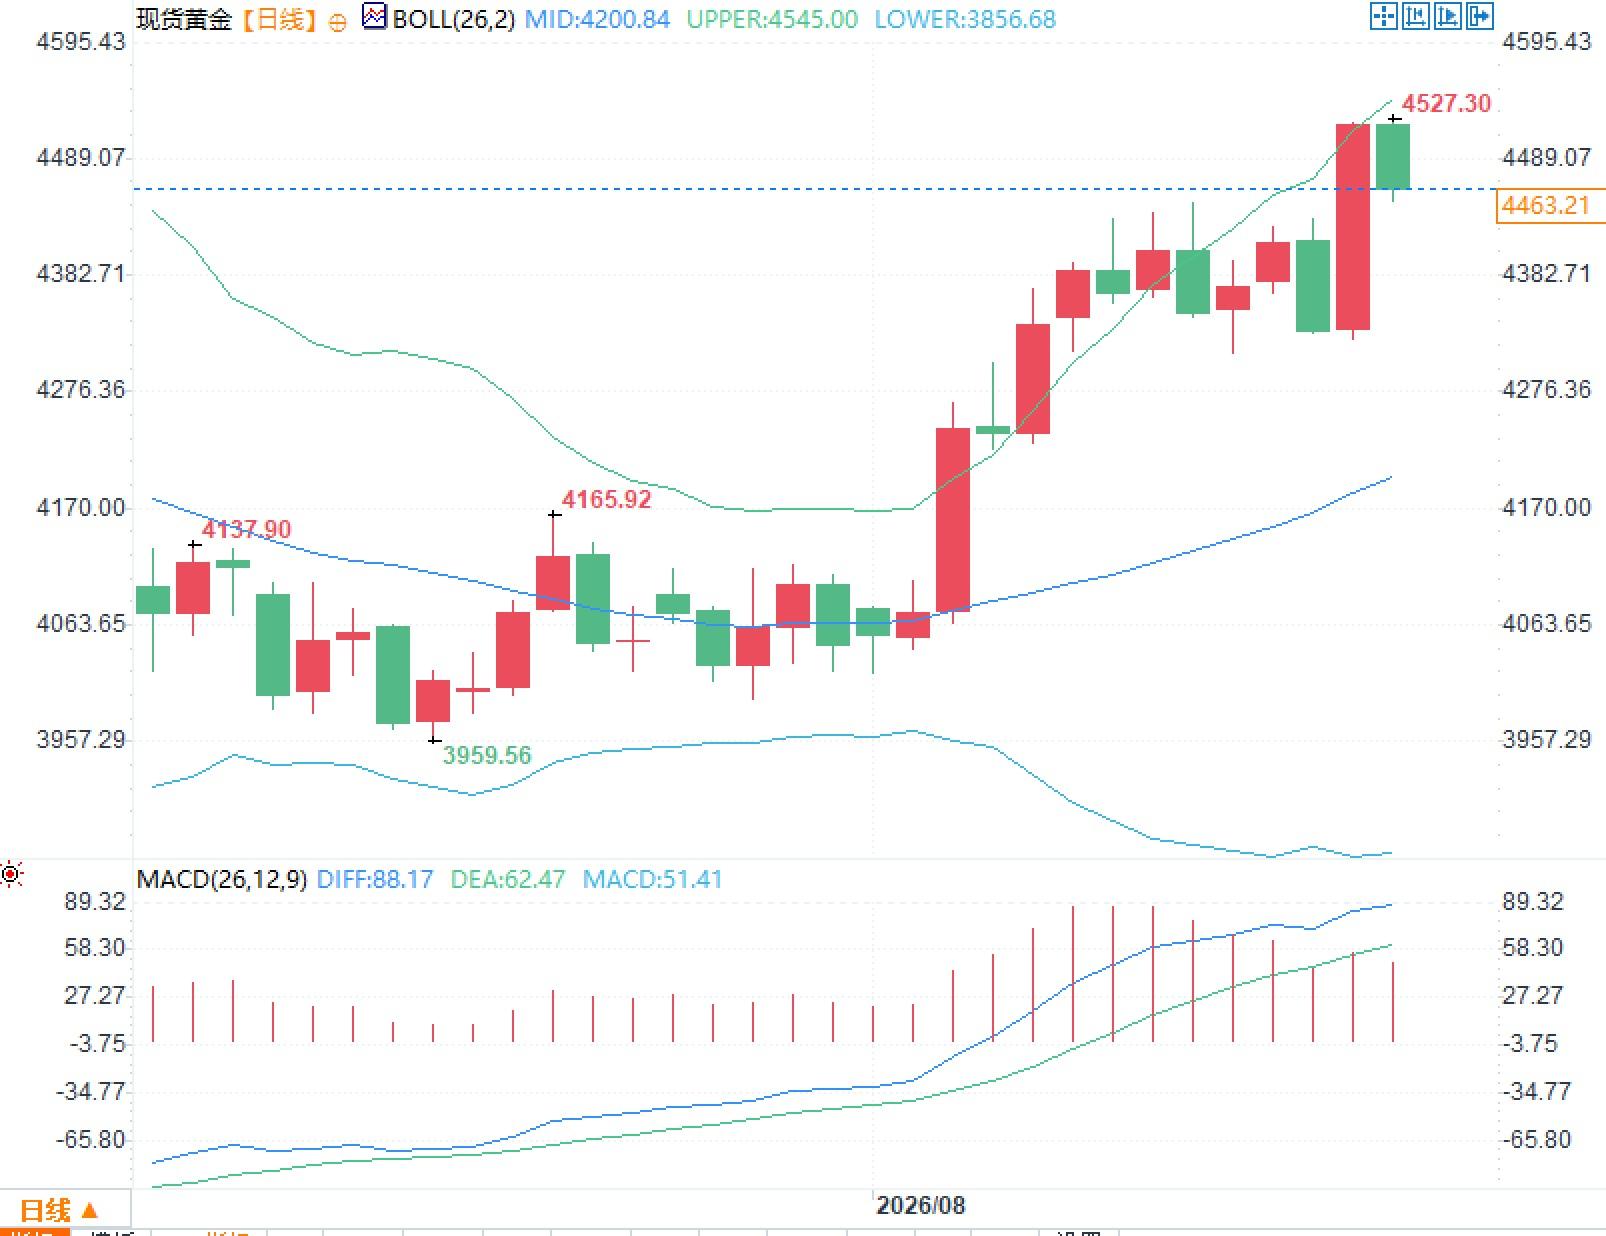 In the MACD indicator, the DIFF is approximately 88.17, the DEA is approximately 62.47, and the histogram value is approximately 51.41, with both lines above the zero line. Gold had previously risen gradually from around $3959/ounce, accelerating significantly after entering August. The latest price action briefly touched around $4527, with the distance to the upper Bollinger Band narrowing significantly. This indicates that the current price has shifted from a balanced state around the middle Bollinger Band to a state of high volatility and expansion.
The reason lies in the fact that one of the core variables in gold trading is not the nominal interest rate itself, but the opportunity cost of holding a non-interest-bearing asset. When the 30-year Treasury yield previously rose to around 5.3%, the high yield imposed a significant valuation constraint on gold. However, after the repurchase policy was announced, the 30-year yield fell by about 7 basis points in a single day, and the 10-year yield fell by about 6 basis points simultaneously, thus giving gold a rapid repricing space. But there is a detail that is easily overlooked here. The fiscal authorities can improve bond market liquidity through repurchase agreements, but they cannot directly eliminate the problems of increased long-term Treasury bond supply, fiscal deficits, and rising term premiums. Therefore, this round of policy is closer to micro-structural adjustments in the market than traditional monetary easing. The strong reaction of gold to this essentially indicates that the market is reassessing the impact of long-term fiscal risks on currency purchasing power and asset allocation frameworks. The most complex aspect of gold at present is that interest rate factors have not formed a one-way driving force. The Federal Reserve maintained the target range for the federal funds rate at 3.50% to 3.75% at its July meeting, but the latest meeting minutes show that three policymakers supported a 25 basis point rate hike, while more officials believed that further tightening might be necessary if inflation did not continue to decline. This means that the market's previous understanding of the policy path needs to be recalibrated. For gold, this creates a clear contradiction. On the one hand, the Treasury's expansion of long-term bond repurchase agreements is suppressing long-term yields, while the dollar's temporary weakness is reducing the opportunity cost of gold; on the other hand, high energy prices are increasing inflation stickiness again, and if inflationary pressures persist, the Fed's ability to maintain high interest rates or even discuss further tightening may be prolonged. This is why gold did not continue its upward trend after a rapid rise of over 4%. The market is actually trading two themes simultaneously: long-term fiscal and monetary purchasing power risks, and the risk of a short-term resurgence in real interest rates. From an asset pricing perspective, this combination usually means that gold volatility may be significantly higher than during a simple rate-cutting phase, because each round of changes in energy prices, inflation data, and bond yields can alter the relative weights of the two pricing logics. Recent changes in the energy market are particularly noteworthy. Conflicts in the Middle East have re-entered the pricing system with concerns about crude oil supply, and rising oil prices simultaneously affect two core variables for gold. The first path is safe-haven demand. When regional uncertainty increases, gold typically gains a risk premium. The second path is entirely different: rising energy prices transmit to inflation through transportation, manufacturing, and consumer costs, strengthening the Federal Reserve's rationale for maintaining restrictive policies. Therefore, the current rise in oil prices is not a traditional one-way benefit for gold. The short-term safe-haven premium and medium-term inflationary interest rate pressures actually hedge against each other. This also explains why the market's sensitivity to bond yields has increased significantly recently. What's truly worth observing is not how much oil prices rise alone, but whether changes in energy prices ultimately drive up nominal yields or down real yields. If inflation expectations rise faster than nominal interest rates, the real interest rate environment for gold will change drastically. Looking at the daily chart, the Bollinger Bands' middle band is approximately $4200.84/oz, the upper band is approximately $4545/oz, and the lower band is approximately $3856.68/oz. After a rapid rise, gold has moved to the upper Bollinger Band area, and the Bollinger Bands have widened again, indicating a significant increase in volatility recently. In the MACD indicator, the DIFF is approximately 88.17, the DEA is approximately 62.47, and the histogram value is approximately 51.41, with both lines above the zero line. Gold had previously risen gradually from around $3959/ounce, accelerating significantly after entering August. The latest price action briefly touched around $4527, with the distance to the upper Bollinger Band narrowing significantly. This indicates that the current price has shifted from a balanced state around the middle Bollinger Band to a state of high volatility and expansion.
- Risk Warning and Disclaimer
- The market involves risk, and trading may not be suitable for all investors. This article is for reference only and does not constitute personal investment advice, nor does it take into account certain users’ specific investment objectives, financial situation, or other needs. Any investment decisions made based on this information are at your own risk.