Breaking the Yield Barrier: The Market Truth Behind Gold's Independent Price Movement
2026-08-24 19:16:59
The spot gold market opened this week in a familiar paradox: spot gold traded at $4,643.26 per ounce, up 0.85%; however, the US dollar index did not weaken, and US real yields remained high. For most of the past two years, this combination would have been a sell signal, but now it's merely a secondary factor. The market has moved away from traditional gold trading logic and entered a completely new operating pattern—gold buying has decoupled from traditional macroeconomic drivers.  Let's clarify the current market environment. The USD/JPY exchange rate is 159.195. Historically, this price level often triggers Japanese investors to reduce their gold holdings used as yen hedges, thus dragging down gold prices. The EUR/USD exchange rate fell to 1.1663, while the USD/CHF exchange rate strengthened to 0.8025. The dollar hasn't collapsed, yet gold continues to rise. This round of gains is driven by physical gold demand and ETF inflows, rather than pure speculation. The real yield logic has failed. Classic trading models posit a negative correlation between gold and the yield on 10-year US Treasury Inflation-Protected Securities (TIPS). Since the second quarter of this year, this model has gradually broken down. Even with real yields hovering at multi-decade highs, gold prices haven't fallen significantly. The core reason is that the internal composition of real yields is far more important than the absolute value of the yield. Gold typically faces downward pressure if rising real yields stem from stronger nominal economic growth expectations; however, if rising real yields are due to a rapid decline in inflation breakeven expectations, gold often stabilizes or even rises—because the market is pricing in deflationary shocks, and central banks are likely to launch large-scale easing policies. The current market falls into the latter scenario. Recent oil price performance supports this: West Texas Intermediate (WTI) crude fell 1.88% to $85.42 per barrel, while Brent crude reached $93.23 per barrel. Inflationary pressures from the energy sector are waning, and inflation breakeven expectations are declining accordingly, but this also increases the probability of central banks shifting to easing. Gold is anticipating a policy shift rather than fighting the current high real yield environment. Dollar Divergence: Seemingly Strong, Actually Structural Divergence The resilience of the US dollar is the most easily overlooked key point in this round of market movements. The fact that Asian currencies did not collectively collapse means that the dollar's strength is only directed at the euro and yen, not across the entire market. This is crucial: if the US dollar strengthens across the board, gold prices will inevitably be under pressure; however, this relative strengthening of the dollar due to the weakness of the economies of Europe and Japan will not stifle the upward potential of gold. Silver's weakening performance: a risk warning or a confirmation of the market trend? Silver is an unavoidable variable in the current market. Silver was trading at $68.831 per ounce, down 0.20%, significantly underperforming gold. The gold-silver ratio has climbed above 67, which is historically high. In a healthy bull market for precious metals, silver should outperform gold, but this has not yet occurred. The divergence between the two indicates that the current buying of gold is driven by defensive safe-haven demand, rather than inflation-driven reflationary trading. In a bull market across all metals, silver would lead the gains. The current shift of funds from silver to gold is a safe-haven signal within the precious metals sector. This round of gold price increases is not driven by short covering, but by the continuous entry of structural funds. This means that the upward momentum of gold prices is more sustainable, but its upside potential will be limited until silver catches up. Three Scenario Analysis Scenario 1 (Bullish Basis): Gold consolidates above $4600 for 48 hours, then weaker-than-expected US economic data pushes gold prices above $4640, targeting $4680; stop-loss is set at a daily close below $4570. Scenario 2 (Bearish Scenario): USD/JPY surges above 160, triggering yen investors to sell gold; gold prices fall back to $4570. If silver simultaneously falls below $68, gold prices will further decline to $4520. Scenario 3 (Basis Neutral Scenario): Gold prices oscillate between $4570 and $4640 over the next week. As the current structural strengthening of the US dollar gradually fades, gold prices slowly rise. Cross- Asset Verification Physical gold and tokenized gold prices are largely consistent, with no significant premium distortion, proving that gold buying has genuine support. The current market is characterized by steady capital accumulation, not a bubble-like surge fueled by speculative funds. The rise of USD/CAD to 1.3842 is noteworthy. A weakening Canadian dollar typically signals downward pressure on commodities, but gold has shown no reaction. This further illustrates that the current gold price surge is not driven by commodity trading, but rather by currency hedging. Investors are buying gold out of distrust in policy responses to the global economic slowdown, not out of bullishness on raw material prices. In summary...
 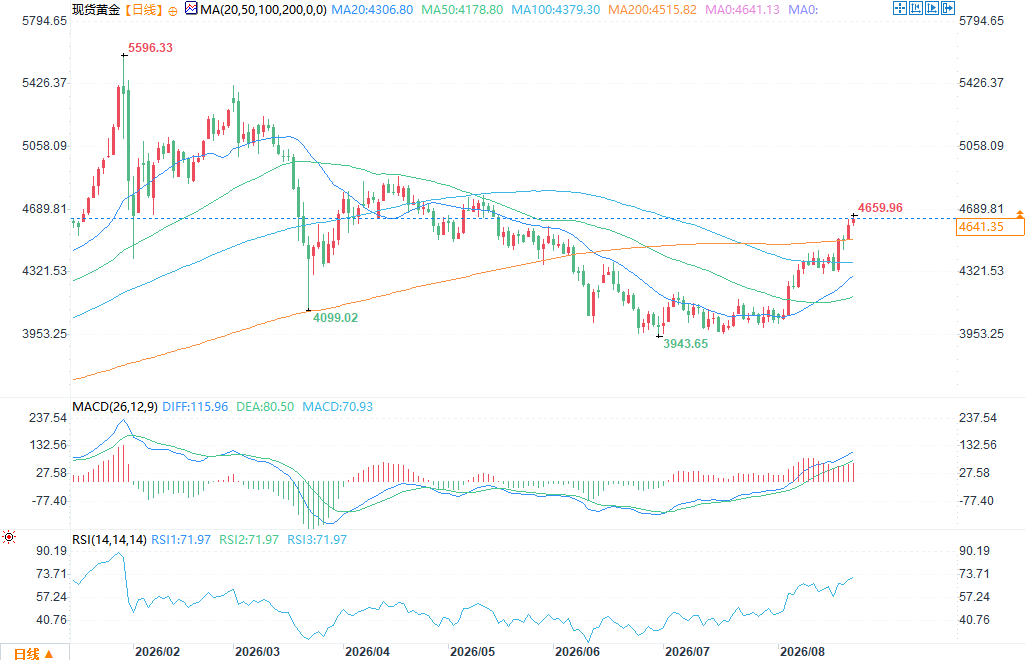 (Spot gold daily chart source: FX678) Gold is exhibiting independent price action. The traditional correlation between real yields and gold prices has been broken, and the strengthening of the US dollar is structural and localized, while silver is lagging behind. All indications suggest that gold buying is primarily driven by its defensive and safe-haven attributes; this pattern is likely to continue until the Federal Reserve releases a clear signal of a shift in policy, or the US dollar weakens across the board. The biggest tail risk at present is a sudden break above 160 against the Japanese yen, which would force a concentrated sell-off of yen-denominated gold positions. Excluding this risk, the upward resistance for gold is smaller.
Let's clarify the current market environment. The USD/JPY exchange rate is 159.195. Historically, this price level often triggers Japanese investors to reduce their gold holdings used as yen hedges, thus dragging down gold prices. The EUR/USD exchange rate fell to 1.1663, while the USD/CHF exchange rate strengthened to 0.8025. The dollar hasn't collapsed, yet gold continues to rise. This round of gains is driven by physical gold demand and ETF inflows, rather than pure speculation. The real yield logic has failed. Classic trading models posit a negative correlation between gold and the yield on 10-year US Treasury Inflation-Protected Securities (TIPS). Since the second quarter of this year, this model has gradually broken down. Even with real yields hovering at multi-decade highs, gold prices haven't fallen significantly. The core reason is that the internal composition of real yields is far more important than the absolute value of the yield. Gold typically faces downward pressure if rising real yields stem from stronger nominal economic growth expectations; however, if rising real yields are due to a rapid decline in inflation breakeven expectations, gold often stabilizes or even rises—because the market is pricing in deflationary shocks, and central banks are likely to launch large-scale easing policies. The current market falls into the latter scenario. Recent oil price performance supports this: West Texas Intermediate (WTI) crude fell 1.88% to $85.42 per barrel, while Brent crude reached $93.23 per barrel. Inflationary pressures from the energy sector are waning, and inflation breakeven expectations are declining accordingly, but this also increases the probability of central banks shifting to easing. Gold is anticipating a policy shift rather than fighting the current high real yield environment. Dollar Divergence: Seemingly Strong, Actually Structural Divergence The resilience of the US dollar is the most easily overlooked key point in this round of market movements. The fact that Asian currencies did not collectively collapse means that the dollar's strength is only directed at the euro and yen, not across the entire market. This is crucial: if the US dollar strengthens across the board, gold prices will inevitably be under pressure; however, this relative strengthening of the dollar due to the weakness of the economies of Europe and Japan will not stifle the upward potential of gold. Silver's weakening performance: a risk warning or a confirmation of the market trend? Silver is an unavoidable variable in the current market. Silver was trading at $68.831 per ounce, down 0.20%, significantly underperforming gold. The gold-silver ratio has climbed above 67, which is historically high. In a healthy bull market for precious metals, silver should outperform gold, but this has not yet occurred. The divergence between the two indicates that the current buying of gold is driven by defensive safe-haven demand, rather than inflation-driven reflationary trading. In a bull market across all metals, silver would lead the gains. The current shift of funds from silver to gold is a safe-haven signal within the precious metals sector. This round of gold price increases is not driven by short covering, but by the continuous entry of structural funds. This means that the upward momentum of gold prices is more sustainable, but its upside potential will be limited until silver catches up. Three Scenario Analysis Scenario 1 (Bullish Basis): Gold consolidates above $4600 for 48 hours, then weaker-than-expected US economic data pushes gold prices above $4640, targeting $4680; stop-loss is set at a daily close below $4570. Scenario 2 (Bearish Scenario): USD/JPY surges above 160, triggering yen investors to sell gold; gold prices fall back to $4570. If silver simultaneously falls below $68, gold prices will further decline to $4520. Scenario 3 (Basis Neutral Scenario): Gold prices oscillate between $4570 and $4640 over the next week. As the current structural strengthening of the US dollar gradually fades, gold prices slowly rise. Cross- Asset Verification Physical gold and tokenized gold prices are largely consistent, with no significant premium distortion, proving that gold buying has genuine support. The current market is characterized by steady capital accumulation, not a bubble-like surge fueled by speculative funds. The rise of USD/CAD to 1.3842 is noteworthy. A weakening Canadian dollar typically signals downward pressure on commodities, but gold has shown no reaction. This further illustrates that the current gold price surge is not driven by commodity trading, but rather by currency hedging. Investors are buying gold out of distrust in policy responses to the global economic slowdown, not out of bullishness on raw material prices. In summary... (Spot gold daily chart source: FX678) Gold is exhibiting independent price action. The traditional correlation between real yields and gold prices has been broken, and the strengthening of the US dollar is structural and localized, while silver is lagging behind. All indications suggest that gold buying is primarily driven by its defensive and safe-haven attributes; this pattern is likely to continue until the Federal Reserve releases a clear signal of a shift in policy, or the US dollar weakens across the board. The biggest tail risk at present is a sudden break above 160 against the Japanese yen, which would force a concentrated sell-off of yen-denominated gold positions. Excluding this risk, the upward resistance for gold is smaller.
- Risk Warning and Disclaimer
- The market involves risk, and trading may not be suitable for all investors. This article is for reference only and does not constitute personal investment advice, nor does it take into account certain users’ specific investment objectives, financial situation, or other needs. Any investment decisions made based on this information are at your own risk.