Crude Oil Analysis: Speculative net long positions plummeted by 28,299 contracts; why did the weekend conflict amplify the position-sharing effect?
2026-08-31 21:34:02
On Monday, August 31, the crude oil market re-priced in the risks associated with the Strait of Hormuz. Following the renewed military strikes between the US and Iran after several weeks, Brent crude returned above $90 per barrel; meanwhile, the national average price of regular gasoline in the US was around $4.08 per gallon, indicating that energy costs remained high. The core factors truly influencing pricing are not a single event headline, but rather the actual traffic volume through the strait, tanker insurance and detouring costs, inventory buffers, and whether new supply can translate into deliverable flows. 
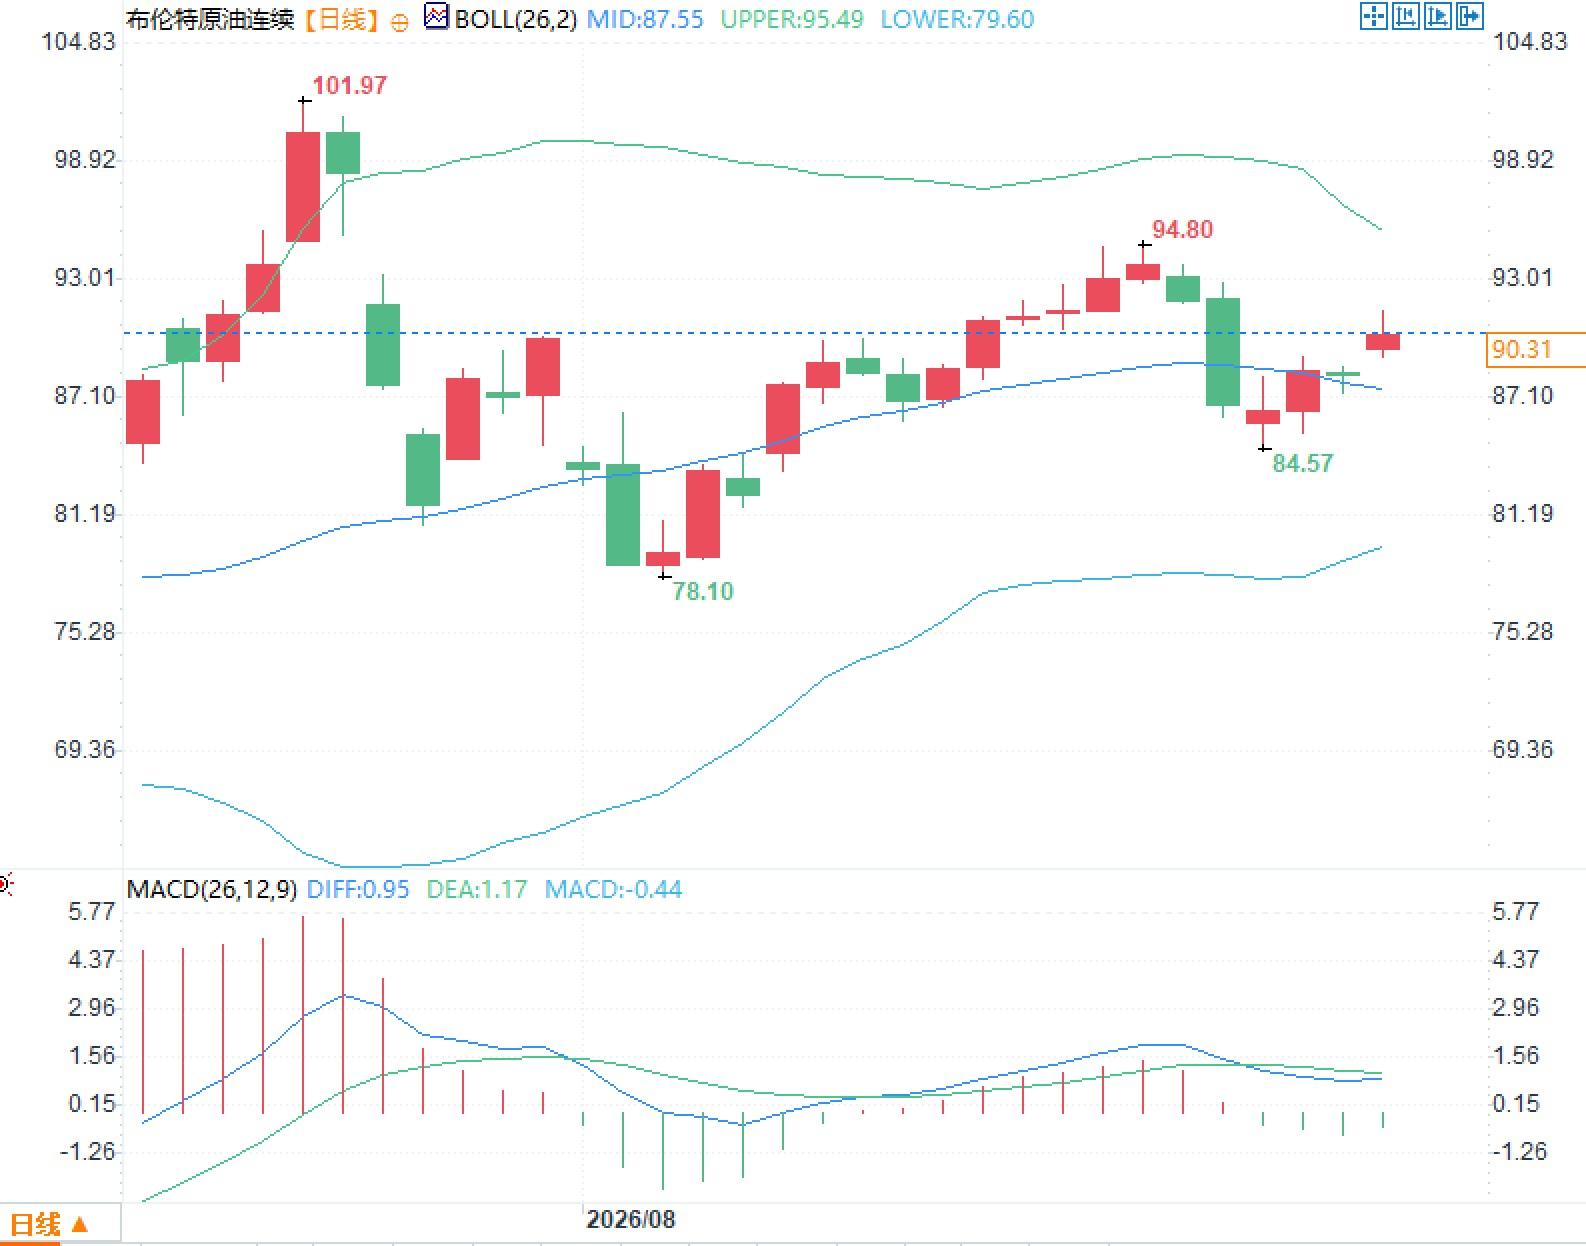 From the daily chart, the current Brent crude oil price is approximately $90.30 per barrel. The Bollinger Bands have a middle band at $87.55, an upper band at $95.49, and a lower band at $79.60, with the bandwidth roughly equivalent to 18% of the middle band. The price is above the middle band but hasn't touched the upper band, reflecting a relatively wide trading range recently. In the MACD indicator, the DIFF is 0.95, the DEA is 1.17, and the histogram is -0.44. Both lines are still above the zero line, but the fast line is below the slow line, indicating that the momentum has somewhat subsided in the previous period.
Strait of Hormuz risk repricing
The market significance of this latest conflict lies in the fact that it occurred at a stage when shipping traffic had just begun to recover. US officials disclosed that approximately 1,500 merchant ships have passed through the strait under escort in the past few months, transporting a total of about 750 million barrels of crude oil; however, commercial vessel tracking estimates for daily traffic are significantly lower, at only about 2 million to 6 million barrels per day at certain times, while other market estimates suggest around 6 million to 8 million barrels per day recently. This difference in estimates is itself a risk variable, as factors such as the closure of ship identification signals, the statistical methods used by escort formations, and loading/unloading times all amplify data noise. The number of visible merchant ships passing through the strait decreased to about 5 per day over the weekend, indicating that shipping companies are again highly sensitive to safety costs. From a pricing mechanism perspective, the "strait tensions" can be broken down into three transmission levels: the first level is the actual loading and departure volumes, determining spot availability; the second level is insurance, chartering, and waiting time, affecting landed costs; and the third level is refinery feedstock substitution and inter-regional price differences, determining whether the impact spreads from crude oil to products such as diesel and jet fuel. Only when physical flow remains restricted will geopolitical premiums shift from being news-driven to being inventory-driven.The 65 billion barrel agreement with Venezuela is not equivalent to immediate supply.
On August 28, Trump stated that the United States and Venezuela had reached an agreement involving more than 65 billion barrels of oil reserves. On August 30, he further stated that the "replenishment process" of the strategic petroleum reserve would begin soon. Venezuelan acting president Delcy Rodríguez subsequently stated that the country "retains ownership and sovereignty over the resources." Public information also mentions 17 oil fields, approximately $100 billion in investment, and more than $209 billion in tax revenue. However, the contract terms, operational control, and legal structure are not entirely consistent across different disclosures; some reports indicate at least 25 years, while others mention longer-term development rights. The most easily misinterpreted aspect of this type of news is treating the reserves directly as supply. 65 billion barrels is underground resource reserves, not a short-term marketable flow. Production also depends on capital expenditure, heavy oil upgrading and processing, oil field decline rates, pipeline and port capacity, equipment imports, financing costs, and contract enforceability. As of August 21, the U.S. Strategic Petroleum Reserve was approximately 289.73 million barrels, near a multi-decade low, making restocking a real possibility. However, whether the new resources can be converted into continuous supply depends on actual investment, project commencement, and shipment data, rather than just looking at the reserve figures.High oil prices and Federal Reserve policies form a new cross term for inflation.
Federal Reserve Chairman Kevin Warsh stated at Jackson Hole on August 28 that the 12-month personal consumption expenditures price index rose by 3.7%, with a 6-month annualized rate of 4.1%, emphasizing that "inflation remains too high" and the policy target remains at 2%. The current target range for the federal funds rate is 3.50% to 3.75%. This means that the renewed rise in energy prices will not only affect commodity markets but will also enter inflation expectations and the interest rate curve through gasoline, transportation, chemical, and service costs. Inventory structure makes this chain more noteworthy. As of August 21, U.S. commercial crude oil inventories were approximately 428.91 million barrels, an increase of only about 100,000 barrels from the previous week; gasoline inventories fell to approximately 206.84 million barrels, a weekly decrease of about 2.54 million barrels, with gasoline supplies lasting approximately 23.2 days. Meanwhile, the national average price of regular gasoline on August 31 was approximately $4.08 per gallon. While crude oil inventories did not show a significant shortage, low refined product inventories and declining strategic reserves made the market more sensitive to disruptions in cross-strait shipping than when only looking at commercial crude oil inventories.Signals from position holdings and daily chart structure
As of August 25, speculative net long positions in Brent crude oil decreased by 28,299 contracts to 223,598 contracts, with the decline mainly due to long position reductions. This indicates that funds were already reducing their risk exposure before the weekend events, and therefore the latest price changes simultaneously reflect both fundamental shocks and position rebalancing. From the daily chart, the current Brent crude oil price is approximately $90.30 per barrel. The Bollinger Bands have a middle band at $87.55, an upper band at $95.49, and a lower band at $79.60, with the bandwidth roughly equivalent to 18% of the middle band. The price is above the middle band but hasn't touched the upper band, reflecting a relatively wide trading range recently. In the MACD indicator, the DIFF is 0.95, the DEA is 1.17, and the histogram is -0.44. Both lines are still above the zero line, but the fast line is below the slow line, indicating that the momentum has somewhat subsided in the previous period.
- Risk Warning and Disclaimer
- The market involves risk, and trading may not be suitable for all investors. This article is for reference only and does not constitute personal investment advice, nor does it take into account certain users’ specific investment objectives, financial situation, or other needs. Any investment decisions made based on this information are at your own risk.