Energy inflation surged to 14.3%, and the most crucial change in the euro market lies within its structure.
2026-09-01 18:26:03
On Tuesday, September 1st, the latest Eurozone inflation data brought market focus back to the European Central Bank (ECB). The Harmonized Index of Consumer Prices (HICP) rose to 3.3% year-on-year in August, up from 2.9% in July, widening the gap to the 2% medium-term target. Meanwhile, energy prices rose 14.3% year-on-year, becoming the core source of this round of inflation. The ECB's current deposit facility rate is 2.25%, and a monetary policy meeting will be held on September 10th. As of August 31st, interest rate market pricing indicated a 98% implied probability of a 25 basis point adjustment. In the currency market, the euro is currently trading around 1.1595 against the US dollar, having fallen slightly during the day. 
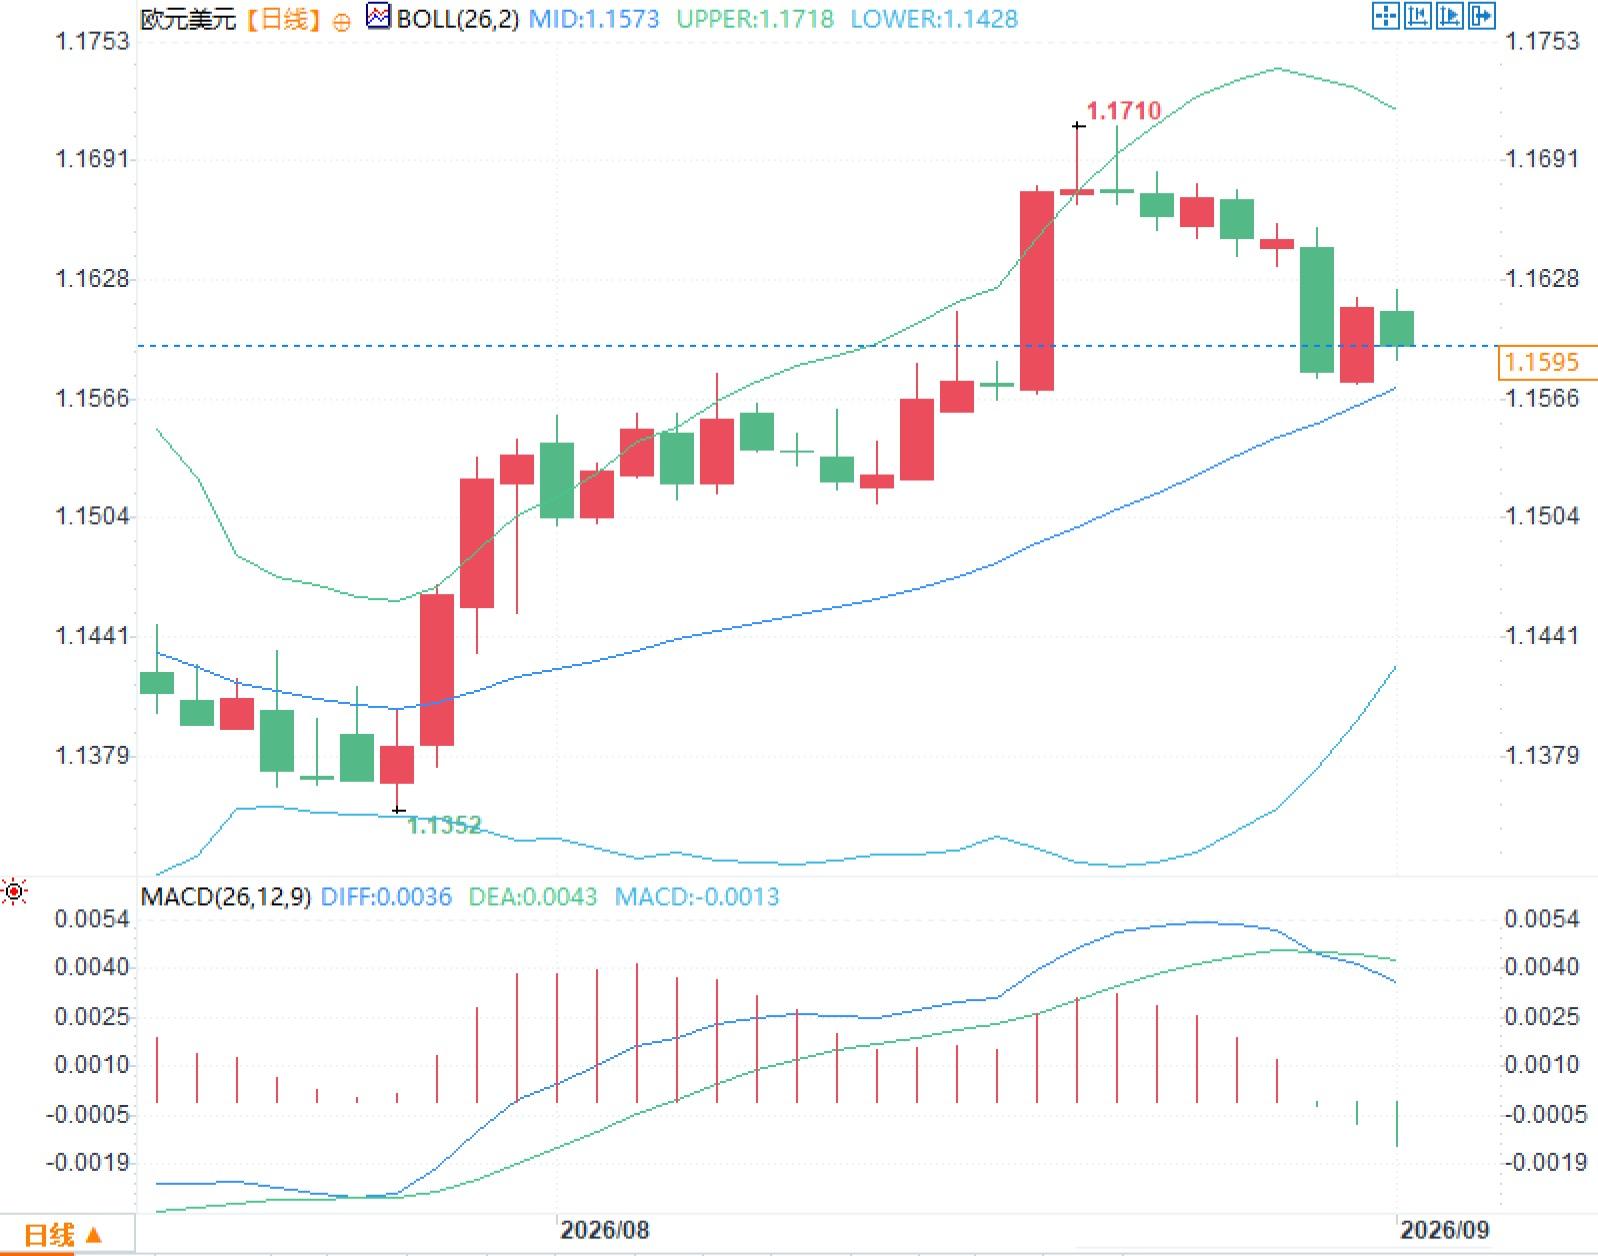 The MACD structure is becoming clearer. The DIFF is approximately 0.0036, the DEA is approximately 0.0043, and the histogram value is approximately -0.0013, indicating that the DIFF is lower than the DEA, but both lines are still above the zero line. This signal describes a decrease in upward momentum compared to the previous period and cannot independently deduce a trend reversal. The price's return from the upper Bollinger Band to the middle band and the MACD histogram turning from positive to negative essentially reflect a convergence between short-term momentum and the strength of the previous trend.
Inflation rose to 3.3%, but its internal structure is more worthy of attention than its overall magnitude.
The 3.3% inflation in August did not represent a simultaneous increase in price pressures across the board. Energy inflation rose further from 10.3% in July to 14.3%, a monthly increase of 2.9%; non-energy industrial goods inflation rose from 0.9% to 1.2% year-on-year. Conversely, the growth rate of service prices fell from 3.3% to 3.0%, and the core index excluding energy, food, alcohol, and tobacco fell from 2.5% to 2.4%, while food, alcohol, and tobacco remained at 1.2%. This means that the current marginal deterioration in inflation is highly concentrated in energy and its direct transmission, rather than a simultaneous acceleration of demand-side price pressures. Regional data also confirms this characteristic. Germany's harmonized inflation was 2.9% in August, with energy prices rising 10.5% year-on-year, but service inflation actually slowed from 2.9% to 2.8%; Spain's harmonized inflation rose to 4.5%, France to 2.7%, and Italy to 3.2%. Energy costs are creating a shared shock, but the transmission magnitude varies significantly across different economies.The policy focus has shifted from individual meetings to the final interest rate decision.
The European Central Bank (ECB) raised its deposit facility rate by 25 basis points to 2.25% in June, but kept it unchanged in July. The latest meeting minutes show that some members believed the current interest rate had not significantly constrained demand and that a moderately restrictive range needed to be considered; however, the committee insisted on decision-making based on data and on a meeting-by-meeting basis, without pre-committing to a fixed interest rate path. Executive Board member Isabelle Schnabel recently stated that at the current policy rate level, medium-term inflation may be difficult to return to the target, thus further tightening is still necessary. Austrian central bank governor Martin Koch emphasized on September 1 that if new forecasts continue to confirm upside risks to inflation, further interest rate adjustments will be necessary. The key to the policy divergence is not that energy prices have already risen, but whether this rise will create a second-round effect through corporate pricing, wages, and inflation expectations. This is also why core inflation of 2.4% and service inflation of 3.0% are particularly important. If energy price increases remain a relatively independent supply shock, policy needs to address imported inflation; if they gradually spread to wages and service prices, monetary policy will face a persistent problem. The degree of interest rate constraint corresponding to the two scenarios is different.The euro against the dollar is not facing a single interest rate logic.
The current exchange rate pricing involves two simultaneous but not necessarily aligned transmission chains. The first stems from policy interest rate differentials: higher-than-target inflation in the Eurozone has led to a renewed rise in short-term interest rate expectations, supporting the relative returns of Euro-denominated assets. The second comes from energy trade terms: high oil and natural gas prices increase energy import costs, simultaneously compressing corporate profits and household purchasing power. Therefore, energy shocks cannot be simply equated with positive exchange rate factors. The global bond market is also adding complexity to this phase. On September 1st, the yield on 10-year US Treasury bonds reached approximately 4.789%, and the yield on 10-year German government bonds reached approximately 3.339%, both at relatively high levels in recent years. The simultaneous rise in long-term yields indicates that the market is trading not only the policy path of a single central bank, but also energy inflation, term premiums, and the repricing of global financing costs. Therefore, for the Euro/USD exchange rate, the focus should be on whether there is a consistent signal among changes in interest rate differentials, energy prices, and core inflation, rather than relying solely on a single inflation data point to explain exchange rate fluctuations.Technical structure displays kinetic energy cooling
Observing the daily chart, the EUR/USD pair gradually moved from around 1.1352 to around 1.1710, before the price broke away from the upper Bollinger Band and returned to the vicinity of the middle band. Currently, the Bollinger Band middle band is around 1.1573, the upper band is around 1.1718, and the lower band is around 1.1428. The middle band is still trending upwards, while the upper band has shifted from expansion to a flattening trend, indicating that the previous one-sided expansion of volatility is rebalancing. The MACD structure is becoming clearer. The DIFF is approximately 0.0036, the DEA is approximately 0.0043, and the histogram value is approximately -0.0013, indicating that the DIFF is lower than the DEA, but both lines are still above the zero line. This signal describes a decrease in upward momentum compared to the previous period and cannot independently deduce a trend reversal. The price's return from the upper Bollinger Band to the middle band and the MACD histogram turning from positive to negative essentially reflect a convergence between short-term momentum and the strength of the previous trend.
- Risk Warning and Disclaimer
- The market involves risk, and trading may not be suitable for all investors. This article is for reference only and does not constitute personal investment advice, nor does it take into account certain users’ specific investment objectives, financial situation, or other needs. Any investment decisions made based on this information are at your own risk.