The US dollar, euro, and Japanese yen are all stuck at their 200-day moving averages; next week's CPI will determine the direction of these three currencies in one fell swoop.
2026-09-05 09:26:04
This week, the foreign exchange market exhibited a textbook "data shock – rapid correction" pattern. US non-farm payrolls increased by 162,000 in August, far exceeding market expectations of 56,000, pushing the US dollar index up sharply in the short term. However, it subsequently gave back most of its gains before the long weekend, ultimately closing at 99.157, still recording a weekly decline of 0.50%. The euro and pound sterling showed mixed performance this week, lacking direction; among commodity currencies, the Australian dollar performed relatively strongly, rising 0.70% for the week; the Swiss franc and Japanese yen became the focus of safe-haven trading. The most noteworthy pair was undoubtedly the USD/JPY, which plummeted 2.35% for the week, not only breaking below the 200-day moving average but also approaching the key level of 155.21 after last month's intervention. On the surface, the non-farm payroll data boosted expectations of an interest rate hike, but the market's pricing in a September rate hike only slightly increased from 50% to 57%, far less than the unexpectedly strong employment data itself. The core issue lies in the fact that wage growth slowed to 3.1% year-on-year, the lowest since June 2021, suggesting that inflationary pressures are still waning. The market's real anchor is no longer employment, but next week's CPI. 
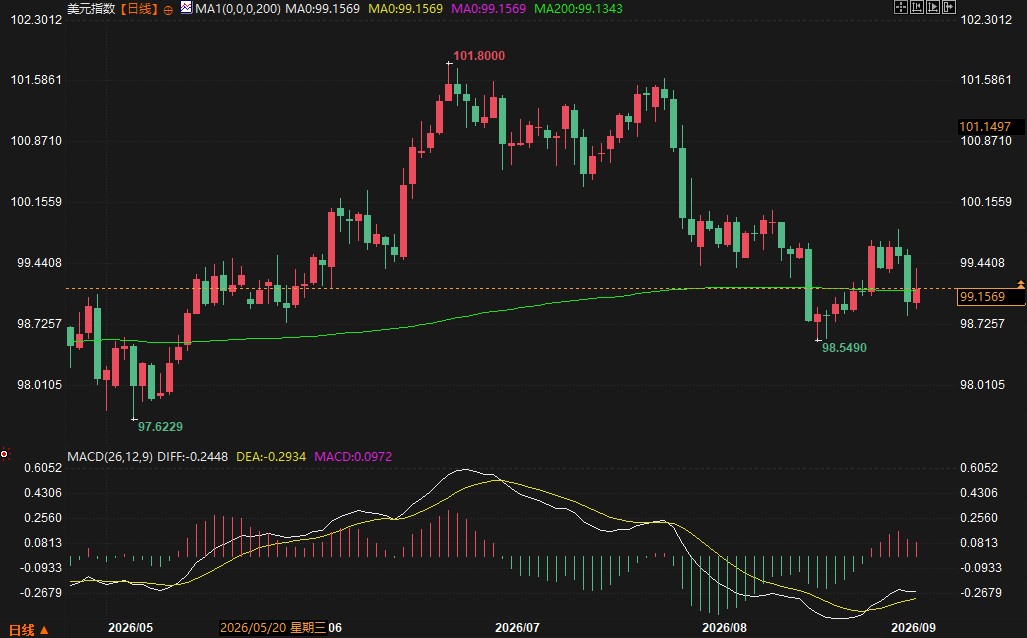
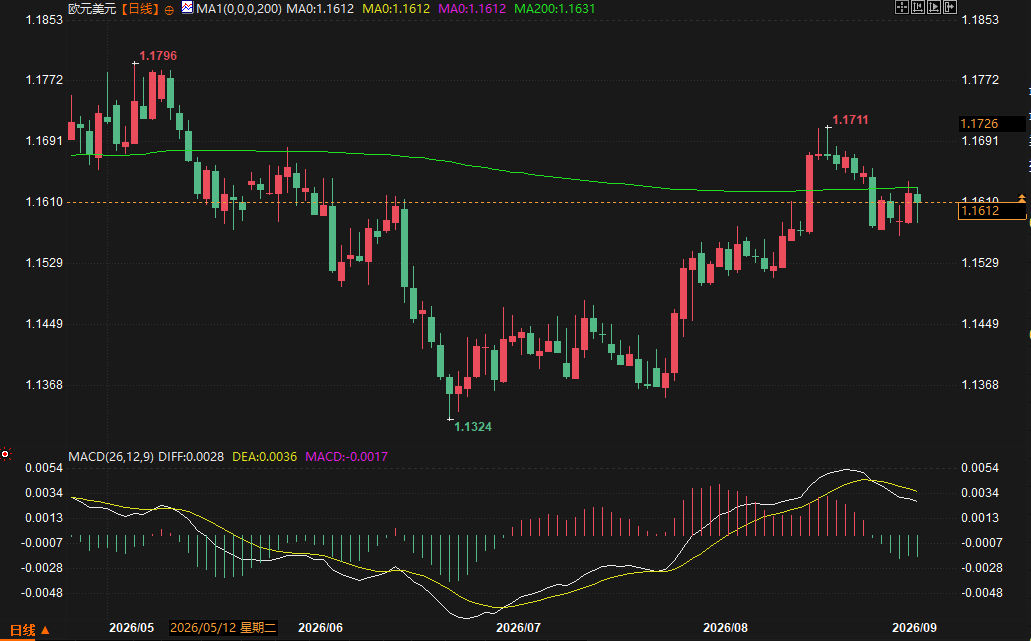
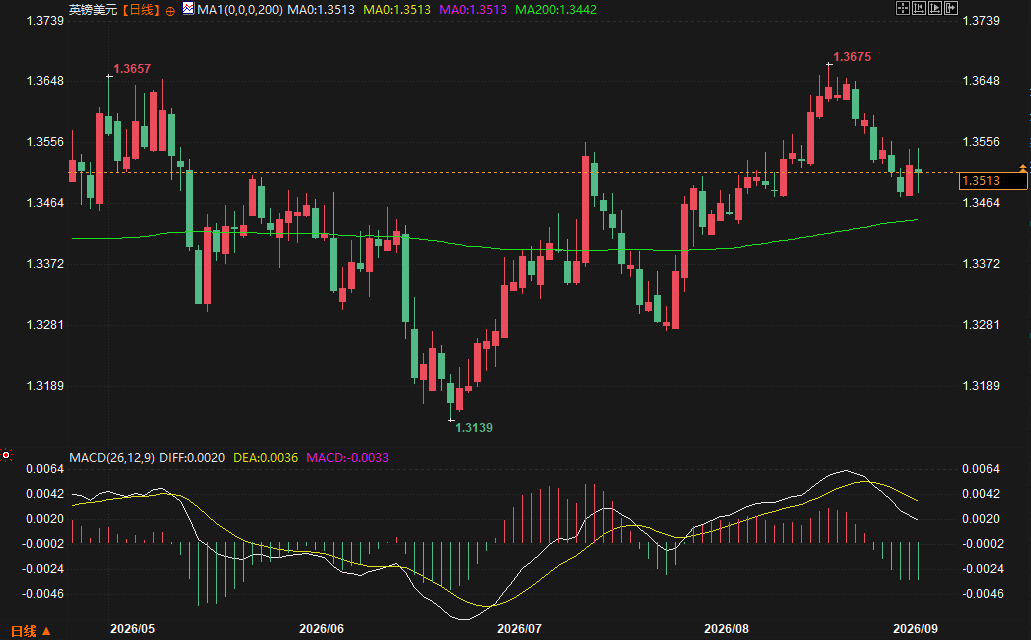
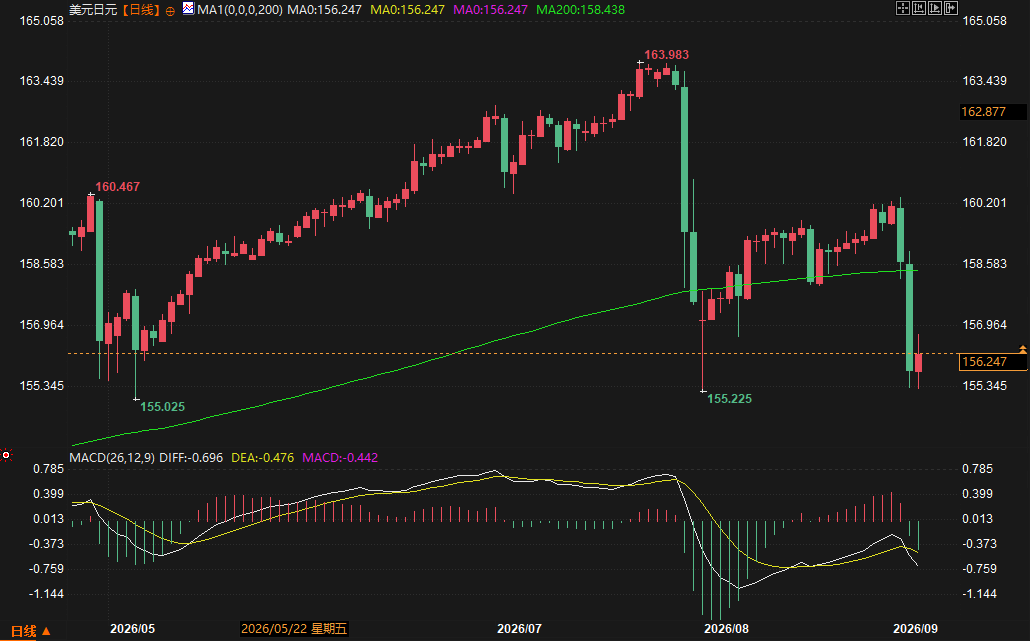
 This week, the core contradiction in the foreign exchange market has become very clear: the weighting of employment and inflation data is subtly shifting. Non-farm payrolls increased by 162,000, far exceeding expectations, but the market's pricing in a September rate hike by the Federal Reserve only rose from 50% to 57%, a much smaller increase than the data's actual impact. Year-on-year wage growth fell to 3.1%, the lowest in nearly five years, further reinforcing expectations of cooling inflation and making some Fed officials more inclined to wait and see. The US dollar index closed close near its 200-day moving average, reflecting the stalemate between bulls and bears at a key level. The Japanese yen plunged 2.35% on the week and broke below its 200-day moving average, becoming the most alarming signal for the entire market. If 155.21 is breached, the chain reaction of short covering in the yen could further amplify. Next week's PPI and CPI data will be the final piece of the puzzle determining the tone of the Fed's September meeting. Before the data is released, the market will likely remain range-bound.
US Dollar Index
This week, the US dollar index exhibited typical event-driven characteristics. It traded in a narrow range around 99.20 at the beginning of the week, holding steady above the 99 level before the release of the non-farm payroll data on Friday. After the data release, the index surged, briefly touching the 99.45 area, but subsequently gave back most of its gains due to traders locking in positions ahead of the US Labor Day long weekend, ultimately closing at 99.157. On the weekly chart, the US dollar index is still down 0.50%, marking its second consecutive week of decline, although the drop is significantly narrower than the previous week. Technically, the US dollar index is currently trading close to the 200-day moving average at 99.13. The last two daily candles closed lower, and although the MACD is still below the zero line, the histogram has turned red, indicating a weakening of short-term downward momentum. Market pricing in a rate hike at the Fed's September meeting remains tight, with federal funds rate futures showing a 57% probability of a rate hike, meaning less than half of bettors still believe that no rate increase in September is more likely. Some traders pointed out that while August's non-farm payrolls were strong, July's data was revised down to a decrease of 23,000, indicating significant volatility in a single month, which is insufficient to form a trend judgment. Next week's PPI and CPI data, especially whether the core CPI year-on-year growth rate can further decline from 2.5% to 2.4%, will be crucial in determining the direction of the US dollar index.Euro against the US dollar
The euro traded in a narrow range against the dollar this week, posting a slight weekly gain of 0.31% to a recent high of 1.1612. On the daily chart, the pair has been fluctuating around the 200-day moving average of 1.1631, exhibiting an alternating pattern of "bearish-bullish-bearish-bullish-bearish" over the past five trading days, indicating that neither side has established a clear advantage. Looking at the week's data, the Eurozone lacked significant economic data to guide the market's direction, with market focus primarily on the US. Following the release of the non-farm payroll data, the euro initially weakened against the dollar but subsequently recovered most of its losses as the dollar gave back its gains. Technically, the euro/dollar pair remains within the consolidation range established after the pullback from 1.1711 in early August, with the 200-day moving average acting as a key support/resistance level. If next week's US CPI data is significantly weaker than expected, the euro may regain upward momentum; conversely, if inflation data is stickier than anticipated, the euro faces pressure to break below the 200-day moving average. Market pricing in the ECB's policy is relatively stable, and the euro's short-term movement depends more on variables related to the dollar.GBP to USD
The British pound fell slightly by 0.15% against the US dollar this week, last quoted at 1.3514, underperforming the euro. From a daily chart perspective, the pound has formed a "bearish-bearish-bullish-bearish-bullish" pattern over the past five trading days, indicating a narrow consolidation. The price remains above the 200-day moving average of 1.3442, suggesting a bullish medium-term trend, but lacking a clear short-term direction. With no major UK economic data releases, the pound is more influenced by the overall movement of the US dollar. Following the release of the non-farm payroll data, the pound briefly dipped, but the decline was limited, and it subsequently rebounded as the dollar weakened. Notably, the pound has tested the 1.3675 area twice in the past month without success, indicating significant upward pressure, while the 200-day moving average provides temporary support. Some traders believe the pound is currently in a "dilemma," requiring external catalysts to break the deadlock. Next week's US CPI data and comments from the Bank of England could be factors that disrupt this balance.US Dollar to Japanese Yen
The USD/JPY pair was the most volatile currency pair this week. It plunged 2.35% on the week, currently trading at 156.247, making it the weakest performing major currency pair this week. The price has clearly broken below the 200-day moving average of 158.44, indicating a bearish medium-term technical structure. Looking at the daily chart, the last five trading days have followed a "bearish-bullish-bearish-bearish-bullish" pattern, with the latest daily candle closing positive, but the rebound was limited, and the price remains below the 200-day moving average. This week's decline in USD/JPY was not driven by a unilateral weakening of the US dollar, but rather by a significant strengthening of the yen itself. Market expectations for further interest rate hikes by the Bank of Japan continue to rise, and rising Japanese government bond yields have sparked discussions about the repatriation of funds from Japanese investors. Traders are watching the key level of 155.21, the high reached by USD/JPY after Japanese authorities intervened in the foreign exchange market last month. A breach of this level could trigger larger-scale position adjustments. Jun Mimura, Japan's top foreign exchange official, reiterated this week that he remains vigilant about the exchange rate movement and that Tokyo is prepared to take action to curb excessive yen depreciation. Furthermore, some major overseas institutions have released analyses suggesting that market expectations regarding the repatriation of Japanese pension funds and interest rate hikes by the Bank of Japan may be "somewhat overblown." However, if a concentrated liquidation of short yen positions amounting to 16 trillion to 17 trillion yen occurs, the USD/JPY pair could potentially weaken further. This assessment reinforces the current downside risk appetite for USD/JPY. Technically, a price rebound to the vicinity of the 200-day moving average may face resistance, while 155.21 is the most important technical reference point in the short term.US dollar against Swiss franc
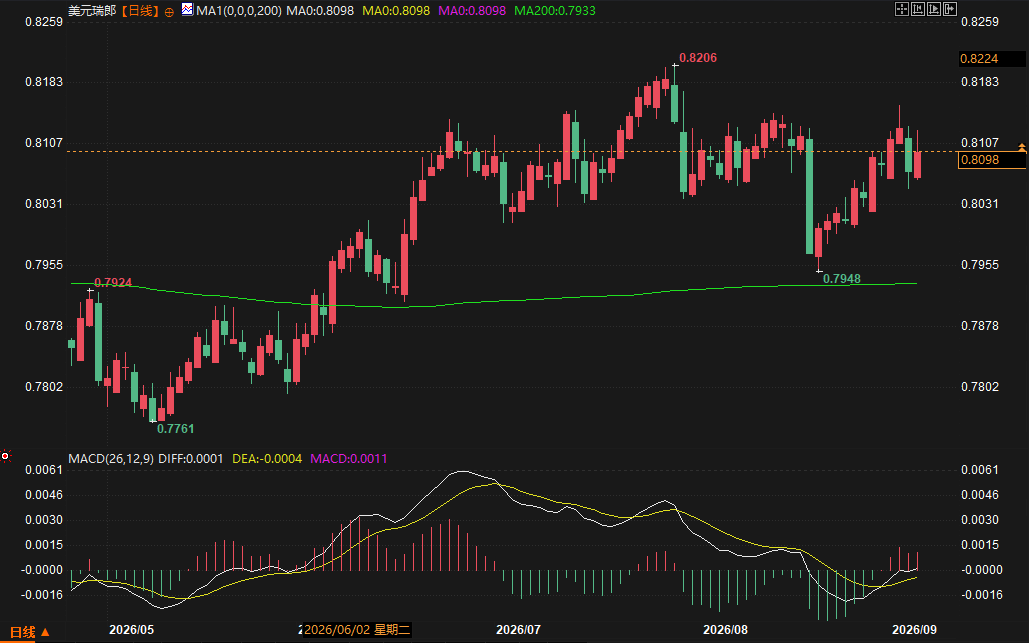
The USD/CHF pair rose slightly by 0.16% this week, last quoted at 0.8099, making it one of the few non-US dollar currencies to weaken against the US dollar. Looking at the daily chart, the pair has followed a "positive-positive-negative-negative-positive" pattern over the past five trading days, closing the week near 0.8100. Technically, USD/CHF remains above the 200-day moving average of 0.7933, indicating a bullish medium-term structure, but short-term upward momentum is insufficient. The Swiss franc's performance this week was mixed, showing weakness against the US dollar but relative stability among cross-currency pairs. With no major Swiss economic data releases, market focus remains on the US dollar's influence. It's worth noting that USD/CHF has been trading within the 0.8000-0.8200 range for several weeks; the upper and lower limits of this range may provide a reference for future price movements.US Dollar to Canadian Dollar
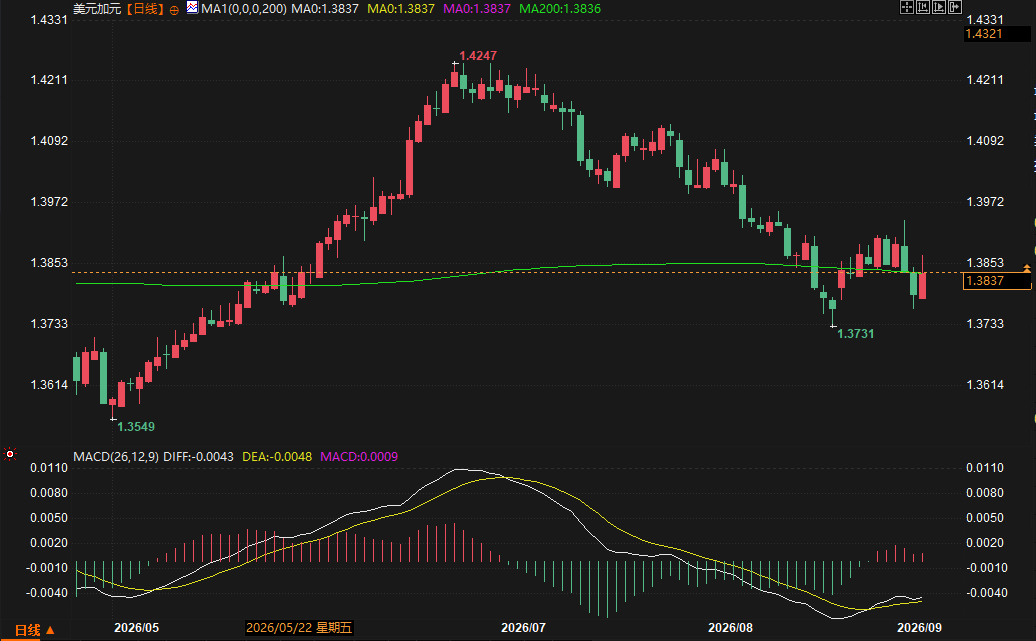
The USD/CAD pair fell 0.48% this week, last quoted at 1.3837, marking its second consecutive weekly decline. Looking at the daily chart, the pair has formed a "positive-positive-negative-negative-positive" pattern over the past five trading days, showing some short-term recovery, but overall remains within a downward channel since the May-June high of 1.4247. The price is roughly coinciding with the 200-day moving average of 1.3836, placing it at a critical juncture. The Canadian dollar's strength this week benefited partly from stabilizing oil prices and market expectations of a relatively hawkish stance from the Bank of Canada. However, the brief surge in the US dollar after the non-farm payroll data provided some upward momentum for the USD/CAD pair. Technically, the USD/CAD pair has formed a complex pattern of multiple support and resistance levels in the current area; its future direction may depend on the overall impact of US inflation data on the US dollar index. This week, the core contradiction in the foreign exchange market has become very clear: the weighting of employment and inflation data is subtly shifting. Non-farm payrolls increased by 162,000, far exceeding expectations, but the market's pricing in a September rate hike by the Federal Reserve only rose from 50% to 57%, a much smaller increase than the data's actual impact. Year-on-year wage growth fell to 3.1%, the lowest in nearly five years, further reinforcing expectations of cooling inflation and making some Fed officials more inclined to wait and see. The US dollar index closed close near its 200-day moving average, reflecting the stalemate between bulls and bears at a key level. The Japanese yen plunged 2.35% on the week and broke below its 200-day moving average, becoming the most alarming signal for the entire market. If 155.21 is breached, the chain reaction of short covering in the yen could further amplify. Next week's PPI and CPI data will be the final piece of the puzzle determining the tone of the Fed's September meeting. Before the data is released, the market will likely remain range-bound.QA module
Q: August's non-farm payrolls increased by 162,000, far exceeding expectations. Why did the market only raise its pricing for a September rate hike from 50% to 57%, instead of a larger upward revision? While the non-farm payroll data significantly exceeded expectations, the market's adjustment in pricing for a rate hike was far less impactful than the data itself. The core reason lies in the directional divergence between wage growth and employment figures. Average hourly earnings in August fell to 3.1% year-on-year, the lowest level since June 2021, and the previous value was also revised downward. For a monetary policy framework anchored to inflation, the continued decline in wage growth indicates a lack of upstream drivers for core service sector inflation, which is more significant as a trend than single-month fluctuations in employment. Furthermore, the July employment data was revised down from an increase to a decrease of 23,000, indicating that the revision itself exceeded market expectation errors. Traders tend to use multi-month trends to smooth out single-month noise when interpreting such highly volatile data. Therefore, although the probability of a September rate hike has increased, the market is unwilling to price in more aggressively before the CPI data release. Whether core CPI can fall back to 2.4% from 2.5% next week as expected is the key variable determining whether it will break through the 50-60% range. If inflation data is weak, the probability of an interest rate hike may fall again; if the stickiness is stronger than expected, then the space for an increase in the probability of an interest rate hike will truly open up. Question: The USD/JPY pair fell by as much as 2.35% this week, and the price has fallen below the 200-day moving average. What is the core driver of this decline? The core driver of the USD/JPY pair's decline this week was not the weakening of the US dollar, but rather the strong buying of the yen itself. First, the market's repricing of the Bank of Japan's interest rate hike path was the main driving force. The continued rise in Japanese government bond yields has significantly narrowed the expected space for the Japan-US interest rate differential, which has put pressure on the reassessment of long-term short yen positions based on carry trade logic. Second, discussions about the repatriation of funds by Japanese investors intensified this week. The market began to focus on whether Japanese insurance companies and pension funds would reduce their exposure to US Treasury bonds and transfer funds back to Japan. Although some overseas institutions believe that this expectation may be excessive, the potential size of their positions is enough to affect market sentiment. Third, the technical breakdown exacerbated the downward momentum. After the USD/JPY pair broke below its 200-day moving average, trend-following funds and stop-loss orders accelerated their outflow, further amplifying the decline. Finally, the number 155.21 itself has strong psychological significance—it's a key price level established after Japanese authorities intervened last month. The current price is not far from this level, and a decisive break below it could trigger larger-scale short covering and technical selling. Statements this week by Japanese foreign exchange official Jun Mimura also reminded the market that Tokyo is prepared to take action, which to some extent limited the USD/JPY's willingness to rebound from its current position. Q: The US dollar index is currently closely following its 200-day moving average. Historically, what does this technical pattern usually signify? A: When the price is closely following the 200-day moving average, and trading volume or volatility does not show a significant increase, it usually means the market is on the eve of a medium-term directional decision. The 200-day moving average reflects the average holding cost over the past ten months and is one of the most important references for trend judgment. The US dollar index fluctuated upwards from a low of 97.62 in May to a high of 101.80 in early July, followed by a sustained decline, and is currently back near the moving average around 99.10. This movement indicates that the previously established medium-term long and short positions have reached a cost equilibrium, with neither side gaining a decisive advantage. Looking at the moving average slope, the 200-day moving average has not yet clearly turned upwards or downwards, further confirming the unclear direction. Meanwhile, the MACD indicator has shown red bars below the zero line, suggesting that short-term downward momentum is weakening, but this alone does not constitute a reversal signal. Historically, after prices repeatedly cross the 200-day moving average, a fundamental catalyst is often needed for a valid breakout. For the US dollar index, next week's CPI data is the most likely catalyst. If core inflation falls to 2.4% or even lower, the US dollar index may choose to break downwards; if the data is higher than expected, the US dollar index is expected to stabilize above the moving average and re-accumulate upward momentum. Q: Overseas institutions have mentioned that the short positions in the Japanese yen amount to 16 trillion to 17 trillion yen. What would be the impact on the exchange rate if these positions were liquidated in a concentrated manner? A: A short position of 16 trillion to 17 trillion yen is a considerable figure for the yen market. These positions were largely established based on carry trade logic against the backdrop of a high interest rate differential between Japan and the US over the past two years. Once the pricing basis changes—whether it's a rise in expectations of a Bank of Japan interest rate hike or an increase in the attractiveness of Japanese government bond yields relative to US Treasury yields—it could trigger profit-taking or stop-loss liquidation of some positions. From a micro-structural perspective, this liquidation behavior has a self-reinforcing characteristic: buying yen after liquidation pushes up the yen exchange rate, and the stronger exchange rate further compresses the profit margin of carry trades, forcing more funds out of the market. Analysis from overseas institutions indicates that if this scale of short positions is liquidated in a concentrated manner, the USD/JPY exchange rate has the potential to move to lower levels. Of course, such a large position will not be cleared overnight; its release pace depends on multiple variables, including policy signals from the Bank of Japan, the rate of increase in Japanese government bond yields, and changes in expectations of interest rates on the US dollar side. There are already signs of some position closing in the market, and the success or failure of the 155.21 technical level will directly determine the acceleration of position closing. Once broken, stop-loss orders and trend-following sell orders may resonate. Q: What will be the impact path of next week's PPI and CPI data on the Fed's September meeting? PPI and CPI describe the transmission chain of inflationary pressures from the production and consumption sides, respectively. PPI will be released next Thursday. Changes in core PPI can provide a forward-looking signal on the direction of commodity prices in CPI, especially whether price pressures on durable goods and intermediate goods continue to ease. If PPI data is weak, the market usually tends to expect a simultaneous slowdown in CPI; conversely, it will increase vigilance regarding CPI stickiness. CPI data is scheduled to be released next Friday, with core CPI year-on-year growth being one of the indicators most closely watched by the Fed. The current market expects core CPI year-on-year growth to fall from 2.5% in July to 2.4%. If the actual data meets or falls below this expectation, it will significantly strengthen the judgment that "inflation is continuing to decline," and the Fed's reasons for holding rates steady in September will be even stronger. However, if core CPI unexpectedly rises, even if it merely remains flat at 2.5% instead of falling as expected, it would be enough to significantly increase expectations of an interest rate hike. This is because the Federal Reserve would then face a combination of strong employment and continued inflationary pressures, a macroeconomic environment more inclined to support tightening. It is worth emphasizing that Federal Reserve Governor Waller has previously stated clearly that if data confirms that inflationary pressures are easing, he tends to advocate maintaining the current interest rate. Therefore, the CPI result will directly influence the stance of several influential officials, including Waller, thus playing a decisive role in the decisions made at the September 15-16 meeting.- Risk Warning and Disclaimer
- The market involves risk, and trading may not be suitable for all investors. This article is for reference only and does not constitute personal investment advice, nor does it take into account certain users’ specific investment objectives, financial situation, or other needs. Any investment decisions made based on this information are at your own risk.