Rising oil prices fueled inflation concerns, causing gold to continue its correction as it awaits guidance from US CPI data.
2026-09-09 09:28:05
International gold prices have been under significant pressure recently. In early Asian trading on Wednesday, spot gold briefly fell to around $4350, continuing its previous correction from higher levels. During the New York session on September 8th, spot gold closed near $4385, a daily decline of approximately 0.4%. Meanwhile, WTI crude oil rose above $93, and Brent crude oil approached $98, indicating that rapidly rising energy prices are once again becoming a significant variable in global inflation expectations.  The recent weakness in gold prices is not solely driven by the US dollar; a more significant pressure comes from changes in interest rate expectations. Previously released US August non-farm payroll data showed an increase of 162,000 jobs, significantly higher than the market's previous expectation of approximately 56,000, with the unemployment rate remaining at 4.1%. This stronger-than-expected employment performance weakened market perceptions of a significant economic slowdown and prompted investors to increase their bets on a September rate hike by the Federal Reserve. Latest market pricing indicates that the probability of a rate hike at the September meeting has risen to approximately 60%, significantly higher than the approximately 50% before the employment data release. Simultaneously, new supply concerns have emerged in the energy market. Tensions in the Middle East continue to escalate, with attacks on some energy facilities and a continuous rise in oil prices. This has led the market to reassess the impact of energy costs on future inflation. For gold, rising oil prices have a clear dual impact. On the one hand, rising energy costs typically strengthen the demand for gold as an inflation hedge; on the other hand, if oil prices remain high and lead to a renewed increase in market expectations for a Fed rate hike, then US Treasury yields may rise further, increasing the holding cost of gold as a non-interest-bearing asset. In the current environment, the latter factor is temporarily dominant, resulting in a market performance where "rising oil prices and increased inflation expectations, yet gold is under pressure." The market's real focus is not on oil price fluctuations alone, but on whether energy prices can further transmit to US consumer prices. The US August Producer Price Index (PPI) will be released on September 10th, and the Consumer Price Index (CPI) on September 11th. The schedule released by the US Bureau of Labor Statistics shows that PPI and CPI will be the two most important inflation data points this week. Previously, the US PPI final demand index was flat month-on-month in July, but rose 4.7% year-on-year, indicating that price pressures on the production side remain. If the August data continues to be driven by rising energy prices, the market may further revise its assessment of future inflation, thus compressing the upside potential for gold. Conversely, if this week's PPI and CPI are lower than expected, market bets on a September rate hike may quickly recede. At that time, US Treasury yields will face downward pressure, and the dollar and real interest rates will weaken simultaneously, which will improve the attractiveness of holding gold. Therefore, the core issue for gold prices in the coming trading days has shifted from simple safe-haven demand to the complete transmission chain of "inflation data—Federal Reserve policy—dollar and bond yields." Looking at global asset performance, the rapid rise in oil prices has begun to impact risk appetite. On September 8th, major US stock indices generally declined, with the Dow Jones Industrial Average falling approximately 1.2%, the S&P 500 falling approximately 0.6%, and the Nasdaq falling approximately 0.3%. Rising energy prices and renewed inflation risks have significantly increased investor concerns about the duration of high interest rates. This means that gold is currently in a rather unique market environment: geopolitical risks and energy supply concerns theoretically provide safe-haven support, but rising interest rate expectations limit the willingness to chase higher prices. Gold previously saw multiple buying opportunities around $4400, but if inflation data continues to reinforce expectations of interest rate hikes, the market may test lower technical support levels. From a daily chart perspective, gold has now broken below the short-term mid-range level, with prices approaching $4350, and the overall trend has shifted from a strong upward movement to a weak and volatile one. The current price level around $4345 is a key technical support, close to the 100-day moving average and a crucial area of recent contention between bulls and bears. If gold prices can stabilize at this level and regain a foothold above $4465, it would indicate a reduction in short-term downward pressure, with further resistance around $4675 to watch. However, if $4345 is breached, the $4255-$4260 area could become the next important support level. The recent RSI is near neutral territory, suggesting the market is not yet in an extremely oversold state, and bears still have room to exert further pressure. Looking at the 4-hour chart, gold remains in a short-term downward trend, with the $4350 level acting as a key support/resistance level. If prices find support in the $4350-$4345 area and break above $4400, a short-term rebound towards the $4440-$4465 area is possible. If the rebound fails to break through $4465, the market may still view it as a corrective move. Conversely, if the $4350 level is decisively broken, accompanied by increased trading momentum, gold prices may seek further support around $4300 or even $4255. Given the upcoming release of PPI and CPI data this week, breakouts on the 4-hour chart are more likely to be data-driven, and investors should be wary of rapid rallies or plunges in the short term.
 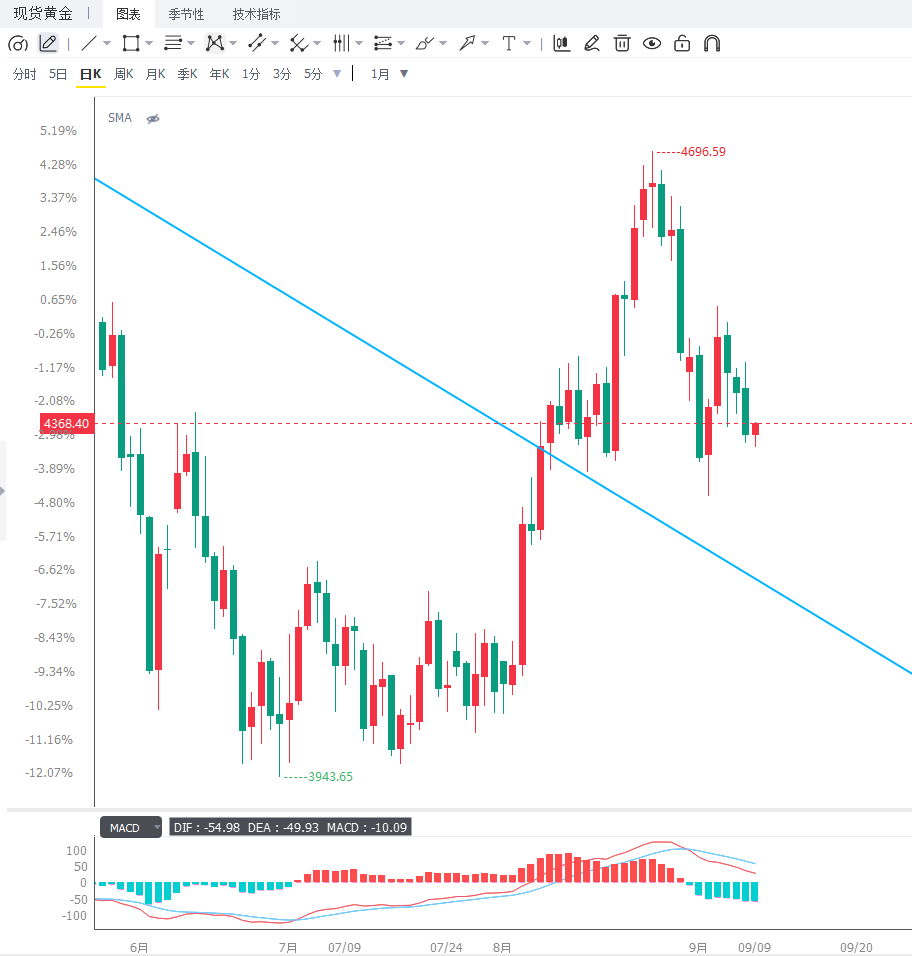 Editor's Summary: Gold is currently at an intersection of macroeconomic policy expectations and safe-haven demand. Oil prices nearing $100 are pushing up inflation risks again, while strong employment data has reinforced market expectations of a Fed rate hike in September, putting significant short-term interest rate pressure on gold. The future direction will truly be determined by US PPI and CPI. If inflation data continues to exceed expectations, gold may seek further support in the $4250-$4300 area; if inflation cools significantly and rate hike expectations subside, the $4350 area may become a new starting point for a rebound. Overall, $4350 is a key area for short-term bulls and bears, while $4465 is a crucial resistance level for determining whether gold can regain strength. Market volatility is expected to remain high before this week's data releases.
The recent weakness in gold prices is not solely driven by the US dollar; a more significant pressure comes from changes in interest rate expectations. Previously released US August non-farm payroll data showed an increase of 162,000 jobs, significantly higher than the market's previous expectation of approximately 56,000, with the unemployment rate remaining at 4.1%. This stronger-than-expected employment performance weakened market perceptions of a significant economic slowdown and prompted investors to increase their bets on a September rate hike by the Federal Reserve. Latest market pricing indicates that the probability of a rate hike at the September meeting has risen to approximately 60%, significantly higher than the approximately 50% before the employment data release. Simultaneously, new supply concerns have emerged in the energy market. Tensions in the Middle East continue to escalate, with attacks on some energy facilities and a continuous rise in oil prices. This has led the market to reassess the impact of energy costs on future inflation. For gold, rising oil prices have a clear dual impact. On the one hand, rising energy costs typically strengthen the demand for gold as an inflation hedge; on the other hand, if oil prices remain high and lead to a renewed increase in market expectations for a Fed rate hike, then US Treasury yields may rise further, increasing the holding cost of gold as a non-interest-bearing asset. In the current environment, the latter factor is temporarily dominant, resulting in a market performance where "rising oil prices and increased inflation expectations, yet gold is under pressure." The market's real focus is not on oil price fluctuations alone, but on whether energy prices can further transmit to US consumer prices. The US August Producer Price Index (PPI) will be released on September 10th, and the Consumer Price Index (CPI) on September 11th. The schedule released by the US Bureau of Labor Statistics shows that PPI and CPI will be the two most important inflation data points this week. Previously, the US PPI final demand index was flat month-on-month in July, but rose 4.7% year-on-year, indicating that price pressures on the production side remain. If the August data continues to be driven by rising energy prices, the market may further revise its assessment of future inflation, thus compressing the upside potential for gold. Conversely, if this week's PPI and CPI are lower than expected, market bets on a September rate hike may quickly recede. At that time, US Treasury yields will face downward pressure, and the dollar and real interest rates will weaken simultaneously, which will improve the attractiveness of holding gold. Therefore, the core issue for gold prices in the coming trading days has shifted from simple safe-haven demand to the complete transmission chain of "inflation data—Federal Reserve policy—dollar and bond yields." Looking at global asset performance, the rapid rise in oil prices has begun to impact risk appetite. On September 8th, major US stock indices generally declined, with the Dow Jones Industrial Average falling approximately 1.2%, the S&P 500 falling approximately 0.6%, and the Nasdaq falling approximately 0.3%. Rising energy prices and renewed inflation risks have significantly increased investor concerns about the duration of high interest rates. This means that gold is currently in a rather unique market environment: geopolitical risks and energy supply concerns theoretically provide safe-haven support, but rising interest rate expectations limit the willingness to chase higher prices. Gold previously saw multiple buying opportunities around $4400, but if inflation data continues to reinforce expectations of interest rate hikes, the market may test lower technical support levels. From a daily chart perspective, gold has now broken below the short-term mid-range level, with prices approaching $4350, and the overall trend has shifted from a strong upward movement to a weak and volatile one. The current price level around $4345 is a key technical support, close to the 100-day moving average and a crucial area of recent contention between bulls and bears. If gold prices can stabilize at this level and regain a foothold above $4465, it would indicate a reduction in short-term downward pressure, with further resistance around $4675 to watch. However, if $4345 is breached, the $4255-$4260 area could become the next important support level. The recent RSI is near neutral territory, suggesting the market is not yet in an extremely oversold state, and bears still have room to exert further pressure. Looking at the 4-hour chart, gold remains in a short-term downward trend, with the $4350 level acting as a key support/resistance level. If prices find support in the $4350-$4345 area and break above $4400, a short-term rebound towards the $4440-$4465 area is possible. If the rebound fails to break through $4465, the market may still view it as a corrective move. Conversely, if the $4350 level is decisively broken, accompanied by increased trading momentum, gold prices may seek further support around $4300 or even $4255. Given the upcoming release of PPI and CPI data this week, breakouts on the 4-hour chart are more likely to be data-driven, and investors should be wary of rapid rallies or plunges in the short term. Editor's Summary: Gold is currently at an intersection of macroeconomic policy expectations and safe-haven demand. Oil prices nearing $100 are pushing up inflation risks again, while strong employment data has reinforced market expectations of a Fed rate hike in September, putting significant short-term interest rate pressure on gold. The future direction will truly be determined by US PPI and CPI. If inflation data continues to exceed expectations, gold may seek further support in the $4250-$4300 area; if inflation cools significantly and rate hike expectations subside, the $4350 area may become a new starting point for a rebound. Overall, $4350 is a key area for short-term bulls and bears, while $4465 is a crucial resistance level for determining whether gold can regain strength. Market volatility is expected to remain high before this week's data releases.
- Risk Warning and Disclaimer
- The market involves risk, and trading may not be suitable for all investors. This article is for reference only and does not constitute personal investment advice, nor does it take into account certain users’ specific investment objectives, financial situation, or other needs. Any investment decisions made based on this information are at your own risk.