The dollar retreated by about 1% during the summer, with the time stamp precisely on the August 19th repurchase statement.
2026-09-10 19:00:06
On Thursday, September 10th, the US dollar index fluctuated narrowly around 98.80, roughly 1% lower than its August high. On the same day, the US Treasury launched its first long-term Treasury liquidity support repurchase operation under this expanded program, raising the single-transaction limit for 10- to 20-year bonds from $2 billion to $6 billion. The market also awaited the European Central Bank's policy decision and the US August Consumer Price Index, to be released the following day. Lee Hardman, a strategist at Mitsubishi UFJ Bank, pointed out that the trigger for the summer dollar weakness was the US Treasury's announcement on August 19th that it would at least double the size of its long-term bond repurchase operations; this operation, intended to lower or cap long-term yields, weakened confidence in the dollar at a time when the risk of rising inflation was increasing. 
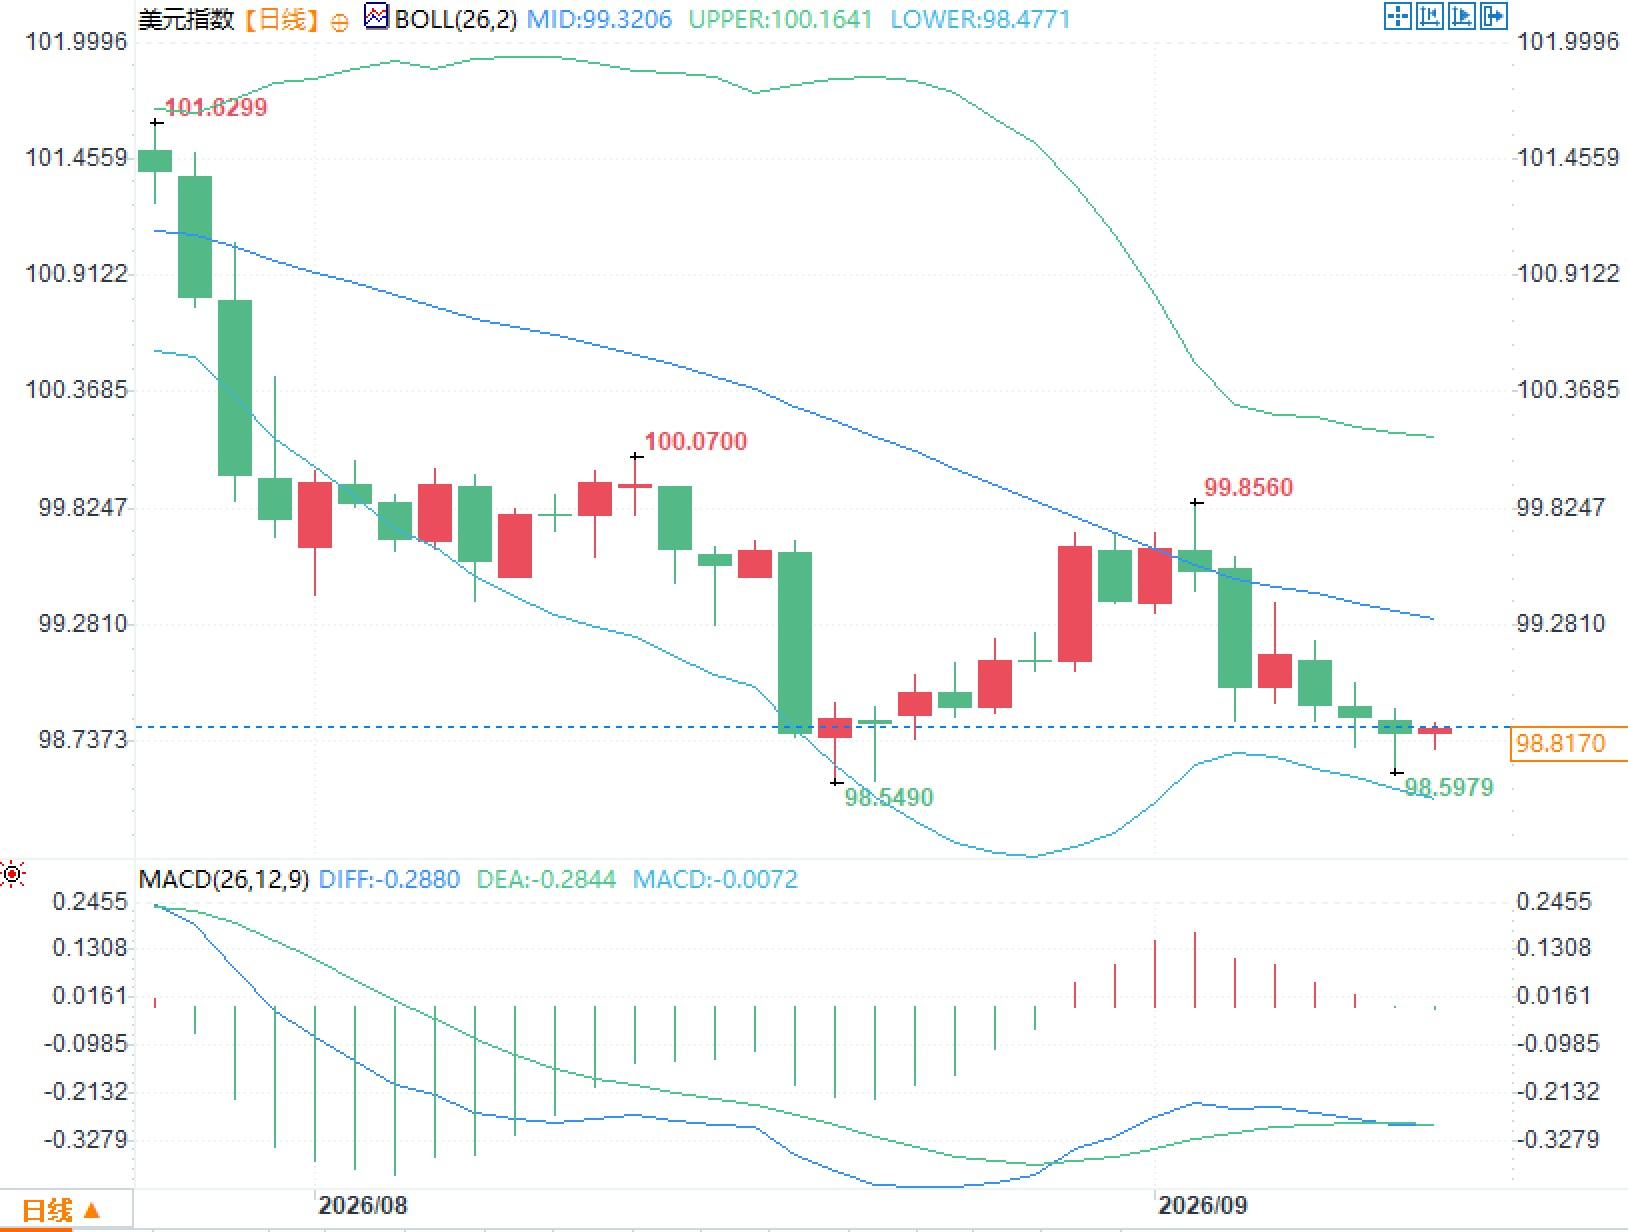 In terms of MACD, the DIFF is approximately -0.2880, the DEA is approximately -0.2844, and the histogram is approximately -0.0072. The two moving averages are nearly converging below the zero line, and the histogram bars have changed from long green bars to short bars, briefly showing red bars before converging again. This combination describes a situation where momentum is weakening and directional divergence coexist: the downward trend after the price left the August high has begun, but the recent shortening of the histogram bars indicates a weakening of unilateral momentum. On the calendar, September 10th coincides with the US Treasury's first $6 billion operation, the ECB's decision, and the following day's US price data. Short-term volatility often amplifies during such windows, but the driving variables have shifted from a single interest rate spread to the relative weights of "repo rules, long-term supply and demand, and inflation readings."
How is the US Treasury's expanded share buyback program rewriting the logic of dollar pricing?
On August 19, the U.S. Treasury announced that from September 9 to November 4, the single-transaction limit for liquidity support repurchase agreements for 10- to 20-year and 20- to 30-year nominal bonds would be increased from at least $2 billion to $4 billion. Further disclosure on September 9 revealed that the maximum size of the first expanded operation on September 10 was increased to $6 billion, equivalent to three times the previous similar operation. Hardman wrote that the announcement itself triggered a sell-off in the dollar, which subsequently remained weak by approximately 1%; after the details of the first larger operation were released, the dollar experienced a brief, mild rebound, but quickly gave back its gains. The change in pricing logic lies not in how much stock the repurchase agreements can absorb, but in the signal conveyed by the official intervention in long-term supply and demand. Long-term Treasury bonds are one of the anchors for global dollar asset pricing. When issuers attempt to mitigate rising long-term interest rates through repurchase agreements, the market reassesses two questions: first, whether long-term interest rates are considered an object requiring management; and second, whether such management is sufficient to change supply expectations. Hardman emphasizes that the US Treasury's efforts to lower or cap long-term yields occurred at a time of increased upside risks to inflation, thus dragging down confidence in the dollar. This deviates from the traditional path of "rising interest rate differentials supporting the dollar": short-term pricing is still digesting the policy rate path, while long-term yields are simultaneously subjected to the dual pull of official repurchase agreements and supply concerns. It's important to distinguish that the source of funds for repurchase agreements differs from central bank balance sheet expansion. The US Treasury's repurchase agreements are an internal replacement within the debt structure, using newly issued or treasury funds to buy back less liquid old bonds, and are not equivalent to money creation. For the dollar foreign exchange market, the confidence channel is more crucial: once investors interpret repurchase agreements as a response to runaway long-term interest rates, the dollar's premium as a financing and reserve currency will be repriced, even if long-term yields do not show a trend of decline.The misalignment between long-term yields and inflation risk
Following the announcement of the $6 billion cap, long-term US Treasury yields initially rose before stabilizing. The 30-year yield initially rose by about 5 basis points, then fell back and stabilized at a level roughly 2 to 3 basis points higher than before; the 10-year yield briefly approached 4.85%, a near three-year high. Currently, the 30-year yield is trading between 5.29% and 5.31%, and the 10-year yield is around 4.84% to 4.86%. Hardman believes this price action may reflect initial market disappointment that the repurchase program is "still not large enough." Meanwhile, inflation data has not given any indication of complacency. The US Consumer Price Index (CPI) for July was 3.4% year-on-year, with a core reading of about 2.5%; the Personal Consumption Expenditures (PCE) CPI for July was 3.7% year-on-year, with a core reading of 3.3%. The Producer Price Index (PPI) for August will be released on September 10, and the CPI for August is scheduled for September 11, followed by the Federal Reserve's policy meeting on September 15-16. Regarding energy prices, Brent crude oil is once again trading above $100 per barrel, with the disruptions to transportation and energy supply caused by Middle East conflicts still reflected in prices. Hardman points out that European yields are more sensitive to summer energy prices, and US short-term yields have also risen in tandem, with the 2-year Treasury yield recently rising by about 4 basis points. This creates a misalignment: repurchase agreements attempt to mitigate long-term interest rates, while price and energy shocks continue to transmit upward risks to inflation expectations. For the US dollar, if long-term rates are "managed" but inflation risks are not simultaneously suppressed, the support for the dollar from real interest rates and nominal interest rate differentials becomes unstable. This doesn't automatically point to a particular exchange rate path, but it explains why the dollar has softened by about 1% since the summer, even though interest rate differentials haven't completely collapsed.Comparing the scale and sustainability of share buybacks with twist operations
Hardman offers a rough estimate: if the US Treasury maintains nine repurchase operations per quarter, with each operation capped at $6 billion, the annualized purchase volume could exceed $200 billion, equivalent to a scaled-down version of the Federal Reserve's "Operation Twist." Operation Twist in 2011-2012 lowered the long end of the bond market by selling short-term bonds and buying long-term bonds; the quarterly purchase volume at that time was significantly higher than the current level of US Treasury repurchases. The US Treasury's long-term Treasury bond issuance plan for this quarter is approximately $231 billion, roughly the same as the previous quarter. Six repurchase operations are still scheduled before November 3rd this quarter, and no new quantitative guidance has been given regarding whether the size of each subsequent operation will be increased. This scale comparison illustrates two points. First, even with linear extrapolation to the upper limit, repurchases remain a supplementary tool relative to the existing Treasury bond market. The daily trading volume of the US Treasury market is in the trillions of dollars; a single $6 billion operation is unlikely to significantly alter the yield curve. Second, what is truly priced is the variability of the rules. The short interval between the "at least double" rule on August 19th and the "three-fold cap" rule on September 9th means the market will likely view the next quarterly refinancing briefing as a new information turning point. Hardman acknowledges that the sustainability of these larger purchases is highly uncertain, and the size of each transaction could potentially increase in the future. This uncertainty itself will translate into a currency risk premium: the more temporary the rules, the more unstable the compensation required for dollar assets. The demand side also needs to be considered. In past long-term bond repurchase transactions, primary dealer bids have often exceeded the cap several times, indicating that selling pressure on existing bonds is not scarce. If, after raising the cap, bids still far exceed transactions, but yields do not decrease, it suggests that the constraint is not on the operational amount, but on the term premium and supply expectations. This will shift the discussion from "whether the repurchase is large enough" to "whether the fiscal path is accepted by the market," the latter having a more lasting impact on the dollar than the number of transactions in a single transaction.Daily chart structure and volatility characteristics of the US Dollar Index
Observing the daily chart, the US dollar index, after falling from its August high of 101.6299, left interim highs at 100.0700 and 99.8560, while reaching a low of around 98.5490, subsequently fluctuating between 98.50 and 99.80. The Bollinger Bands' middle band is approximately 99.3206, the upper band is approximately 100.1641, and the lower band is approximately 98.4771. The latest price is around 98.80, trading below the middle band and close to the lower band. After a significant narrowing of the bandwidth compared to August, the lower band rose somewhat in early September, indicating that volatility has shifted from expansion to contraction. In terms of MACD, the DIFF is approximately -0.2880, the DEA is approximately -0.2844, and the histogram is approximately -0.0072. The two moving averages are nearly converging below the zero line, and the histogram bars have changed from long green bars to short bars, briefly showing red bars before converging again. This combination describes a situation where momentum is weakening and directional divergence coexist: the downward trend after the price left the August high has begun, but the recent shortening of the histogram bars indicates a weakening of unilateral momentum. On the calendar, September 10th coincides with the US Treasury's first $6 billion operation, the ECB's decision, and the following day's US price data. Short-term volatility often amplifies during such windows, but the driving variables have shifted from a single interest rate spread to the relative weights of "repo rules, long-term supply and demand, and inflation readings."
- Risk Warning and Disclaimer
- The market involves risk, and trading may not be suitable for all investors. This article is for reference only and does not constitute personal investment advice, nor does it take into account certain users’ specific investment objectives, financial situation, or other needs. Any investment decisions made based on this information are at your own risk.