Spot silver is hovering near its lowest level since August 10. Is the Fed's decision a turning point?
2026-09-15 12:08:12
On Tuesday (September 15) during the Asian session, spot silver traded in a narrow range, currently hovering around $63.30 per ounce, remaining near its lowest levels since August 10. Silver prices may face further depreciation as high oil prices have exacerbated market expectations of a Federal Reserve interest rate hike. 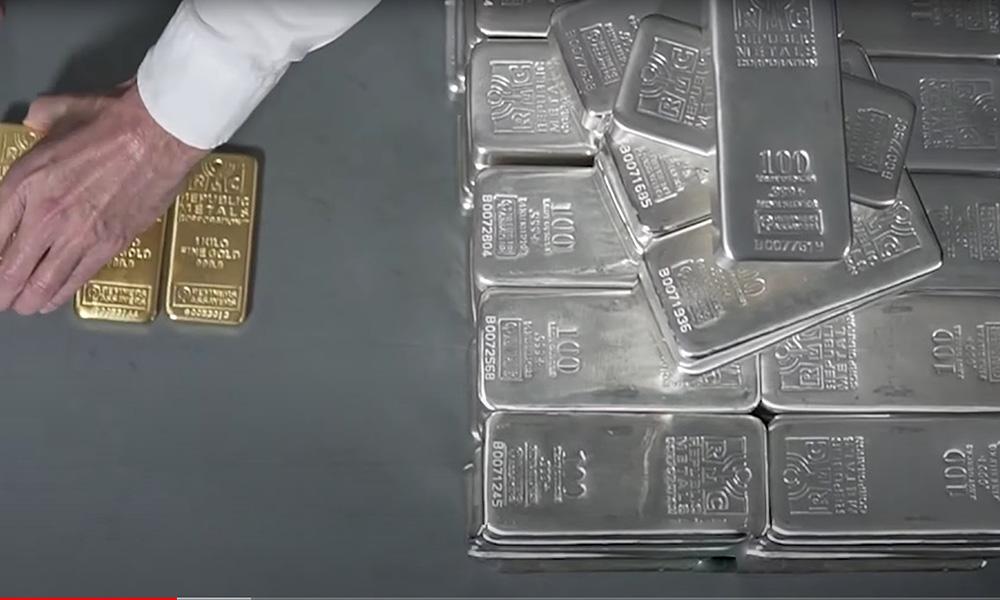
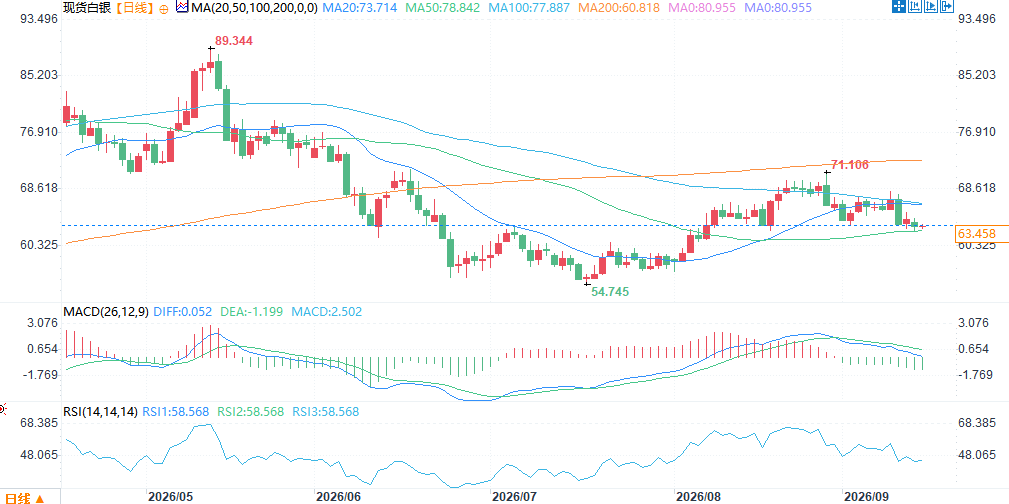 (Spot silver daily chart, source: EasyTrade) At 12:04 Beijing time, spot silver was trading at $63.32 per ounce.
Interest rate hike expectations surge, US Treasury yields approach 5%.
Rising energy costs have exacerbated inflation concerns, putting greater pressure on the Federal Reserve to tighten monetary policy. As a result, the probability of a rate hike in the money market surged to over 92% on Tuesday, compared to only about 60% a week earlier. Economic data further reinforced these expectations – the US August CPI rose, with core inflation recording its largest increase in four months. Furthermore, driven by broader inflation and fiscal concerns, the 10-year Treasury yield approached 5%, putting additional downward pressure on non-interest-bearing precious metals such as silver. The market is currently repricing the Fed's policy path at a significantly faster pace. Continued supply disruptions in the Middle East have pushed up crude oil and refined product prices, directly increasing the energy component's contribution to overall inflation, challenging the previously anticipated narrative of a "temporary shock." The strong rebound in August's core CPI further confirmed that underlying inflationary pressures have not completely subsided, reinforcing the need for the committee to take action at this week's meeting. The 10-year Treasury yield approaching the 5% mark reflects not only rising expectations of a rate hike but also market concerns about long-term fiscal deficits and debt sustainability. Rising yields have directly increased the opportunity cost of holding non-interest-bearing assets such as silver, leading to some funds flowing out of the precious metals market. Overall, energy, data, and yields are resonating together, which will continue to suppress risk appetite in the short term and have a ripple effect on the prices of related assets.The dual logic behind silver: the Federal Reserve controls short-term fluctuations, while supply and demand determine the long-term bottom.
The core impact of the Fed's decision this week on silver depends on the hawkishness of the policy statement and dot plot relative to market pricing, rather than the rate hike itself. The market has already priced in a roughly 92% probability of a rate hike, and a mere 25 basis point increase "in line with expectations" is unlikely to constitute a new negative factor. The real variable lies in the dot plot: if the median forecast of the 18 committee members confirms one more rate hike this year, silver may face a new round of selling pressure, with the $63 support level becoming a battleground; if the dot plot is less hawkish than the market expects, the already suppressed silver price may experience a "sell the news" type of corrective rebound. However, it's necessary to distinguish between two levels. In the short term, the repricing of interest rate expectations is the core mechanism suppressing silver prices—the real yield on 10-year US Treasury bonds has risen to around 2.55%, and the opportunity cost of holding non-interest-bearing assets continues to rise. Silver, due to its industrial attributes, is more sensitive to changes in macroeconomic interest rates than gold. In the medium to long term, the sixth consecutive year of silver supply shortages and the rigid growth in industrial demand from solar energy, data centers, and other sectors constitute a physical bottom unrelated to the interest rate cycle. If silver prices fall below $60 following the Fed's decision due to hawkish signals, it will trigger further technical selling; if the decision is not hawkish enough, it may initiate a correction towards the $65-70 range. In short, the Fed determines the direction of short-term fluctuations, not the fate of silver's structural bottom.Institutional View: CTA positions are only moderately long, with significant room for scenario divergence.
TD Securities points out that its latest CTA tracking data shows that trend-following funds' current CTA holdings in silver are only equivalent to a moderate net long position, and there is still room for adjustment as prices evolve. The institution's scenario analysis clearly distinguishes between CTA holdings under three scenarios: "sharp decline," "moderate decline," and "sideways movement," emphasizing that systemic fund flows may substantially differ depending on whether silver experiences a sharp sell-off, a slow decline, or broad sideways movement in the coming months. The institution's model shows that current CTA net long positions in silver are far from extreme levels, meaning that if prices weaken further, systemic selling may accelerate; conversely, if stabilization or a rebound occurs, there is still room for increasing positions. In the "sharp decline" scenario, CTAs may quickly turn net short, amplifying downward volatility; a "moderate decline" corresponds to a gradual reduction in positions without triggering panic selling; and in the "sideways movement" scenario, the adjustment in positions is limited, with the market being more driven by fundamentals and macroeconomic factors. This scenario differentiation highlights the high sensitivity of systemic funds to the silver price path. Investors need to closely monitor the CTA's reaction after the price breaks through key technical levels, as changes in positions themselves can be a significant amplifier of short-term market movements. (Spot silver daily chart, source: EasyTrade) At 12:04 Beijing time, spot silver was trading at $63.32 per ounce.
- Risk Warning and Disclaimer
- The market involves risk, and trading may not be suitable for all investors. This article is for reference only and does not constitute personal investment advice, nor does it take into account certain users’ specific investment objectives, financial situation, or other needs. Any investment decisions made based on this information are at your own risk.