Gold retaliated against the interest rate shock in just one trading day?
2026-09-17 21:24:10
On Thursday, September 17th, spot gold rebounded significantly following the Federal Reserve's interest rate hike. The Federal Reserve raised the target range for the federal funds rate by 25 basis points to 3.75% to 4.00% early this morning, marking the first rate hike since 2023. The statement noted that economic activity was expanding at a solid pace, domestic spending remained resilient, and the unemployment rate was little changed, while emphasizing that inflation remained high. This adjustment aims to push prices back to the 2% target more promptly. The US dollar index has fallen to around 100.05, down about 0.27% on the day; the 10-year US Treasury yield has fallen to around 4.95%; and the cooling of the oil price rally has also affected US Treasury pricing. Spot gold has rebounded to around $4370, up about 2.50% on the day. The core issue the market is digesting is not the 25 basis points themselves, but rather the reassessment of the subsequent constraint path based on the dot plot and the Fed Chairman's statements. 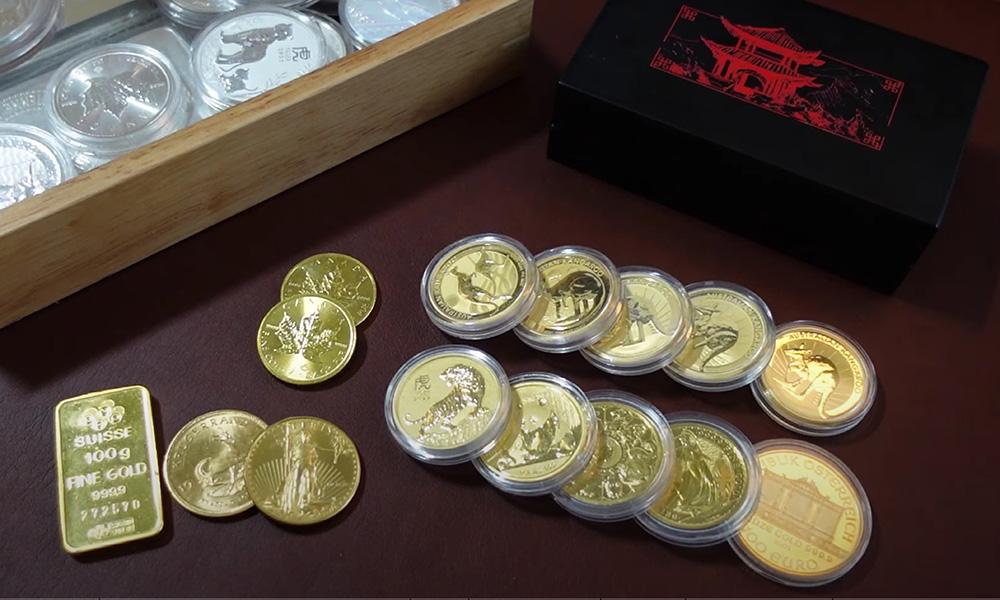
Interest rate hike text, dot plot, and revaluation of carrying costs
The Federal Reserve's decision passed unanimously. The updated dot plot shows that 16 of the 18 officials who submitted forecasts expect at least another 25 basis point rate hikes this year, with a median pointing to a policy rate of 4.1%. For non-interest-bearing assets, what truly changes pricing is not the absolute value of a rate hike, but rather the market's rewriting of the probability of "another hike" into forward rates. Fed Chairman Warsh described the rate hike after the meeting as removing a "patch of easing," stating that financial conditions were barely constrained and inflation remained too high—a judgment widely shared within the committee. He also mentioned three changes since the July meeting: increased economic activity, no significant slowdown in inflation, and escalating geopolitical tensions. These statements shift the policy narrative from "wait and see" to "insufficient constraints," thus revaluing the opportunity cost of gold relative to interest-bearing assets. Two layers need to be distinguished: one is the already implemented 25 basis point hike, and the other is the dot plot's majority opinion on another rate hike this year. The former changes the overnight rate, while the latter changes the curve slope and real interest rate expectations. Thursday's yield decline from its weekly high suggests that the impact of the rate hike has been partially priced in at the trading level, but it does not mean that the policy path has been fully priced in by the market. Warsh also declined to predict every subsequent meeting, emphasizing his reluctance to draw conclusions about future decisions, noting that uncertainty about the path itself will be factored into volatility premiums.Employment resilience, inflation stickiness, and the boundaries of dollar repatriation
The latest weekly initial jobless claims in the US were 196,000, lower than the expected 208,000 and the previous week's 206,000; the four-week moving average also declined, and continuing claims were lower than expected. The labor market has not given a signal of "rapid easing," which corroborates the statement that "the unemployment rate has not changed much." More directly impacting gold pricing is how the resilience of employment will constrain the pace of inflation decline. The dot plot has revised upwards its year-to-date overall inflation and core inflation forecasts, with median forecasts of 3.7% and 3.4% respectively, higher than the June path. Warsh stated that "inflation is too high and has persisted too long," and indicated that it is necessary to confirm that underlying inflation is moving towards the target at a sufficient pace, a standard that is not yet met. The dollar index has fallen from 100.37, but this does not change the fact that, with most officials still writing in one more rate hike this year, dollar selling pressure is likely to be limited to short-term profit-taking rather than a trend-driven exit. As a non-interest-bearing asset, gold still retains elasticity to real interest rates and the dollar, but the extent of this elasticity depends on whether the bond market treats "one more rate hike" as a high-probability event. The cooling of crude oil prices pulled US Treasury yields back from their weekly highs, opening a window for a rebound in precious metals on Thursday. If energy prices subsequently rise again, inflation expectations and nominal yields may move upwards in tandem again, tightening the cost-of-holding logic once more. Employment data only indicates that the pace of unemployment claims has not accelerated; it cannot be used to infer that inflation has entered a sustained decline.Current status of daily indicators
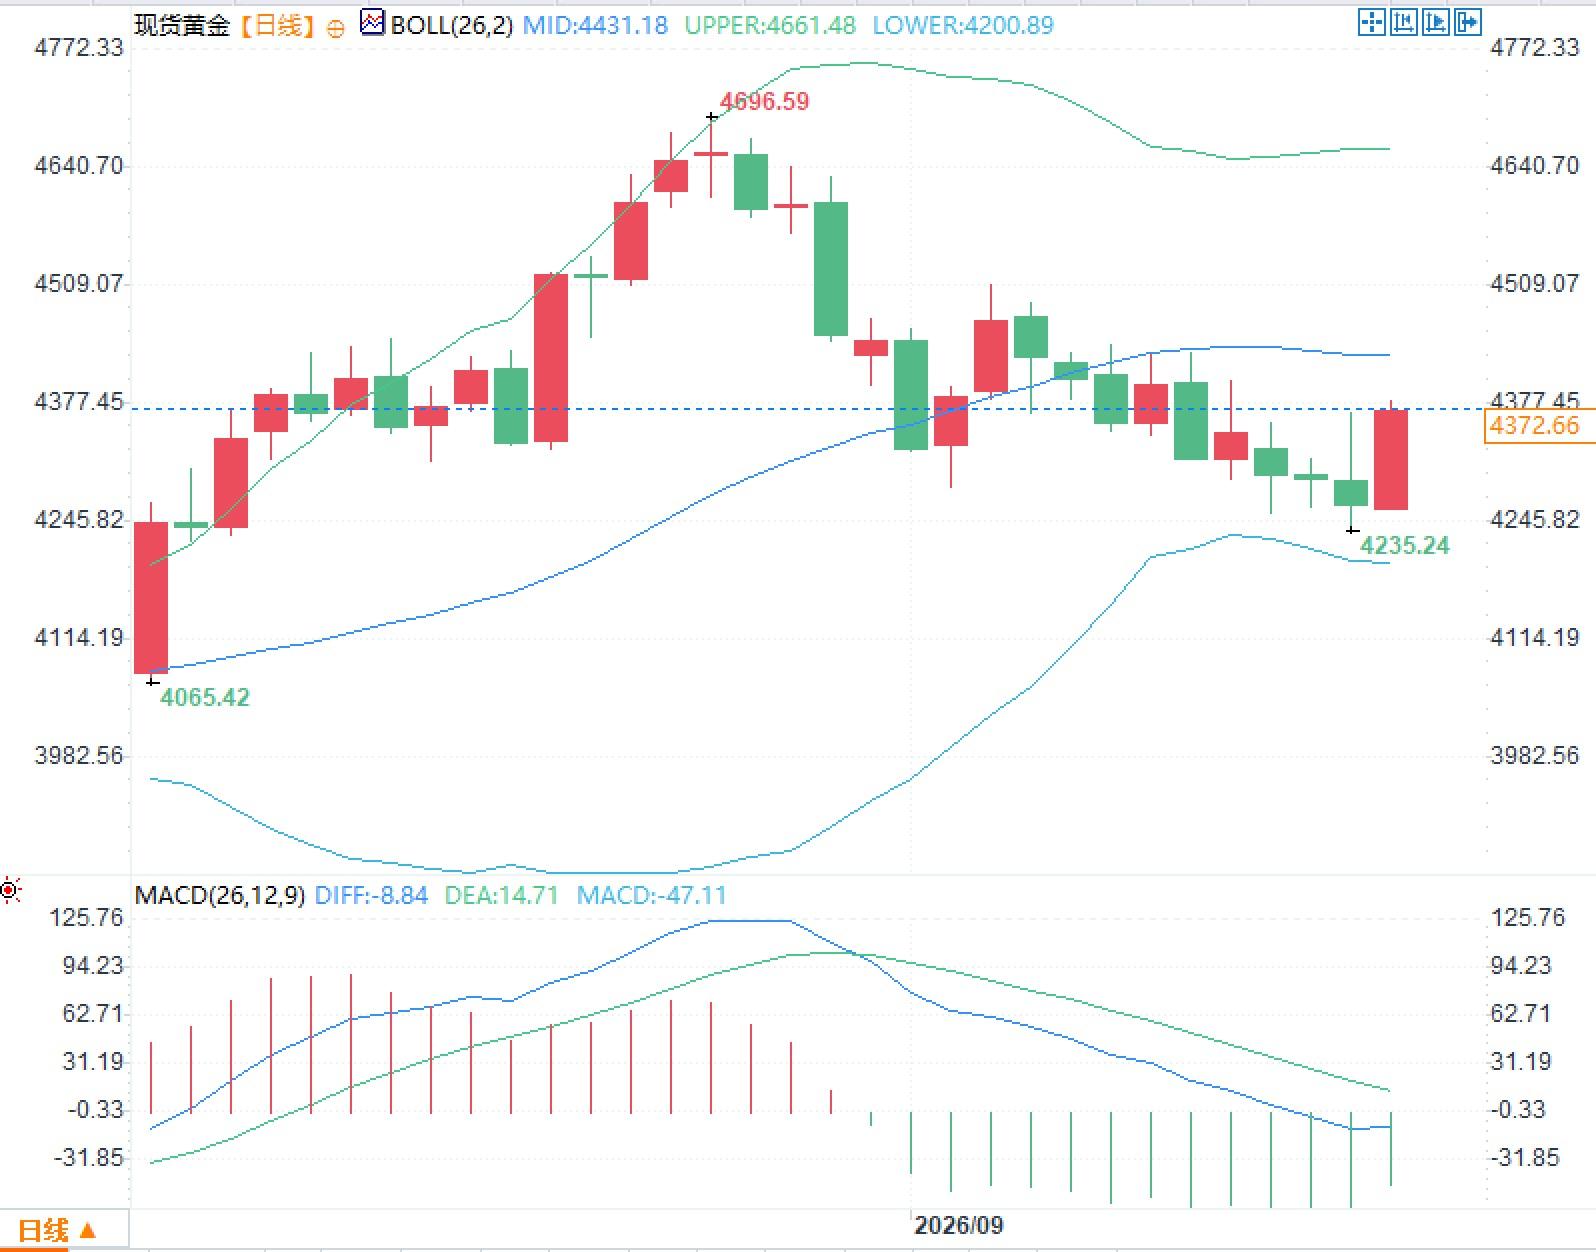
From a daily chart perspective, the Bollinger Bands have the middle band at approximately 4431.18, the upper band at approximately 4661.48, and the lower band at approximately 4200.89. After falling from the previous high of around 4696.59, the price has recently been trading below the middle band. Wednesday's low was marked around 4235.24, followed by a long lower shadow and a subsequent rebound. The MACD shows a DIFF of approximately -8.84, a DEA of approximately 14.71, and a MACD histogram of approximately -47.11. The fast and slow lines remain near the zero line, and the histogram remains below the zero line. These readings indicate two things: first, the medium-term volatility channel remains wide, with the distance between the upper and lower bands corresponding to a significant historical volatility period; second, the momentum indicator has not yet returned to a bullish alignment above the zero line. After an interest rate hike, volatility typically increases initially and then decreases. Thursday's gold price rebound occurred within a window of simultaneous yield and dollar pullback, representing a price rematch after the interest rate shock and should not be interpreted in isolation as a complete shift in the trend structure.The coexistence of geopolitical premiums, a cooling oil market, and safe-haven demand.
The Middle East situation continues to carry weight in pricing. The US has stated that the conflict is "close to its end" and indicated the other side's willingness to reach an agreement; meanwhile, Saudi Arabia and the Houthis are still exchanging blows, and regional tensions have not completely disappeared from the premium. Warsh listed geopolitical factors as one of the variables driving this decision since July, stating that global hotspots cannot be ignored, and the committee's assessment of the conflict's evolution has changed, no longer simply viewing energy shocks as disturbances that can be waited for to subside. This has a two-way impact on gold: the conflict premium provides safe-haven demand, and if energy prices fall due to cooling conflict expectations, it will alleviate nominal interest rate pressure through the yield channel. Thursday's gold rebound overlapped with three factors: a dollar pullback, a decline in US Treasury yields from around 5.04%, and a cooling oil market rally; it is not a single narrative. As long as regional strikes continue, safe-haven demand will not be removed from the function; as long as the dot plot still lists another strike this year as the majority opinion, the holding cost of non-interest-bearing assets will not be ignored by the market. The simultaneous existence of both is the true form of current pricing. What needs to be observed going forward is whether energy prices and real interest rates will move in the same direction again, and whether policymakers' statements on whether "financial conditions have been restricted" will be rewritten in their next speech.- Risk Warning and Disclaimer
- The market involves risk, and trading may not be suitable for all investors. This article is for reference only and does not constitute personal investment advice, nor does it take into account certain users’ specific investment objectives, financial situation, or other needs. Any investment decisions made based on this information are at your own risk.