EUR/USD Forex Trading Signal: A break below 1.1375 indicates a bearish outlook.
2026-09-28 18:32:13
The core factor currently dominating the foreign exchange market is the strong performance of the US dollar. US Treasury yields recently hit their highest level in nearly 20 years, providing support for the dollar. The dollar has recently risen against almost all currencies; from a technical perspective, the dollar is about to make a crucial breakout against the euro, pound sterling, and some other European currencies. For euro/dollar traders, the key question now is: will this breakout materialize, or will the market soon reverse?  Euro/Dollar Fundamentals and Market Sentiment Analysis The Euro/Dollar exchange rate is driven more by the US dollar than by the euro itself, a common phenomenon in the forex market—75% of forex trading involves the dollar. The dollar has retreated slightly from its two-month high, but long-term US Treasury yields are approaching 19-year highs, providing support. Meanwhile, market expectations for further Fed rate hikes are intensifying. The CME FedWatch Tool shows the market is currently pricing in a 70% probability of another 0.25% rate hike at the Fed's October meeting, compared to only 53% just two weeks ago. Trump's policies aim to attract capital inflows into the US domestic capital market, stimulating dollar buying and providing additional support for the dollar. While US economic growth is not particularly impressive, it remains relatively robust, with inflation lower than in most OECD member countries. The euro's fundamentals are mixed: the ECB raised its deposit rate to 2.50% in September, providing some support for the euro, and the ECB expects the Eurozone economy to be resilient. However, Eurozone economic growth remains weak, with a projected growth rate of only 0.9% in 2026 and an inflation forecast of 3.0%. High energy costs and potential inflationary pressures continue to plague the region. Overall, tight monetary policy is beneficial to the euro, but limited economic growth prospects do not support a significant appreciation of the euro. EUR/USD Technical Analysis
 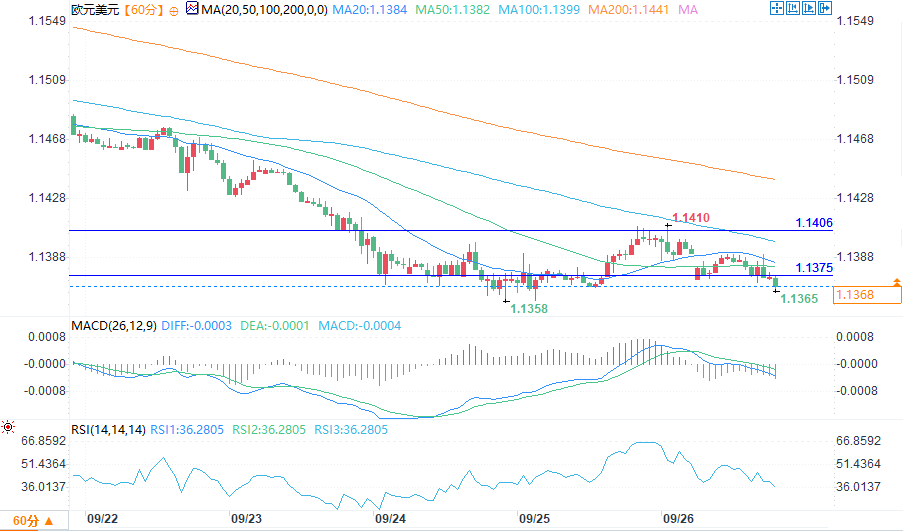 (EUR/USD hourly chart source: FX678) After a deep decline of approximately two weeks, recent price action has shown signs of forming a bullish bottom. The hourly chart is initially forming a bullish head and shoulders pattern, with a key support level at 1.1375, but the pattern has not yet established a clear neckline. In short: if the price effectively holds below 1.1375, it will release a clear bearish signal, and traders can enter short positions accordingly. The key resistance level for bulls is 1.1406, which is the strongest resistance in the vicinity and resonates with the psychological level of 1.1400. The pair is clearly in a downtrend on a larger timeframe, therefore shorting is supported by the trend, while going long is a contrarian trade. The probability of a downward move is higher, making it the more valuable direction for trading. If today's daily close breaks below 1.1375, trend-following funds and institutional money will enter short positions, and ordinary traders will also short, essentially aligning themselves with large institutions. Unless you are a highly experienced trader and anticipate an impending pullback in the US dollar, it is advisable to wait for the price to break out of the 1.1406-1.1375 trading range before taking any action. If you are an experienced trader, you can try a short-term long position when the price retraces to 1.1375 and shows a rebound signal. However, you must strictly manage risk and expect the market to develop further into a trend, at least ensuring that the trade does not result in a loss.
Euro/Dollar Fundamentals and Market Sentiment Analysis The Euro/Dollar exchange rate is driven more by the US dollar than by the euro itself, a common phenomenon in the forex market—75% of forex trading involves the dollar. The dollar has retreated slightly from its two-month high, but long-term US Treasury yields are approaching 19-year highs, providing support. Meanwhile, market expectations for further Fed rate hikes are intensifying. The CME FedWatch Tool shows the market is currently pricing in a 70% probability of another 0.25% rate hike at the Fed's October meeting, compared to only 53% just two weeks ago. Trump's policies aim to attract capital inflows into the US domestic capital market, stimulating dollar buying and providing additional support for the dollar. While US economic growth is not particularly impressive, it remains relatively robust, with inflation lower than in most OECD member countries. The euro's fundamentals are mixed: the ECB raised its deposit rate to 2.50% in September, providing some support for the euro, and the ECB expects the Eurozone economy to be resilient. However, Eurozone economic growth remains weak, with a projected growth rate of only 0.9% in 2026 and an inflation forecast of 3.0%. High energy costs and potential inflationary pressures continue to plague the region. Overall, tight monetary policy is beneficial to the euro, but limited economic growth prospects do not support a significant appreciation of the euro. EUR/USD Technical Analysis (EUR/USD hourly chart source: FX678) After a deep decline of approximately two weeks, recent price action has shown signs of forming a bullish bottom. The hourly chart is initially forming a bullish head and shoulders pattern, with a key support level at 1.1375, but the pattern has not yet established a clear neckline. In short: if the price effectively holds below 1.1375, it will release a clear bearish signal, and traders can enter short positions accordingly. The key resistance level for bulls is 1.1406, which is the strongest resistance in the vicinity and resonates with the psychological level of 1.1400. The pair is clearly in a downtrend on a larger timeframe, therefore shorting is supported by the trend, while going long is a contrarian trade. The probability of a downward move is higher, making it the more valuable direction for trading. If today's daily close breaks below 1.1375, trend-following funds and institutional money will enter short positions, and ordinary traders will also short, essentially aligning themselves with large institutions. Unless you are a highly experienced trader and anticipate an impending pullback in the US dollar, it is advisable to wait for the price to break out of the 1.1406-1.1375 trading range before taking any action. If you are an experienced trader, you can try a short-term long position when the price retraces to 1.1375 and shows a rebound signal. However, you must strictly manage risk and expect the market to develop further into a trend, at least ensuring that the trade does not result in a loss.
- Risk Warning and Disclaimer
- The market involves risk, and trading may not be suitable for all investors. This article is for reference only and does not constitute personal investment advice, nor does it take into account certain users’ specific investment objectives, financial situation, or other needs. Any investment decisions made based on this information are at your own risk.