With Gulf shipping volumes plummeting to 2.9 million barrels per day, is the structure of crude oil freight costs being reshaped?
2026-10-13 21:42:18
On Tuesday, October 13, Brent crude oil traded around $105 per barrel, with limited intraday volatility, but the recent price range has widened significantly. Market focus is on the rapidly changing shipping security situation around the Strait of Hormuz. Data from shipping monitoring agencies shows that 24 vessels have been attacked in the past two weeks, with six vessels attacked on October 11 alone, setting a new single-day record since the start of this conflict. The attacks targeted product tankers, crude oil tankers, and container ships, with some crew members missing or injured. Shipowners' willingness to load cargo in the area has significantly decreased, with some vessels turning back from anchorages in the Gulf of Oman to other, relatively safer loading areas. This change has directly impacted the pace of Gulf crude oil exports and pushed global tanker freight rates to record levels. 
Shipping attacks reach a new high in intensity.
According to statistics from shipping safety monitoring agencies, the six vessels attacked on October 11 included three product tankers, two crude oil tankers, and one Indian-flagged container ship. Two of the crude oil tankers belonged to South Korean shipowners. Several Indian-flagged vessels had been attacked in the preceding days, resulting in injuries to crew members. India has publicly expressed its concern and called for a swift resolution to the conflict. Compared to the previous peak of attacks in early March, the number of vessels attacked in this two-week period has increased from 13 to 24, indicating a significant increase in intensity. Shipowners, who were previously willing to take the risk due to high freight rates, have begun to avoid the area after the recent series of attacks, choosing to detour or travel to other production areas for loading. This change in behavior not only extends voyages but also increases the frequency of ship-to-ship transshipment, further exacerbating the shortage of effective shipping capacity.Gulf crude oil shipments decline sharply
Commodity tracking data shows that Gulf crude oil shipments averaged 15.5 million barrels per day in September, the highest level since the start of the conflict. However, entering October, with the increase in the frequency of attacks, the number of transit vessels plummeted. On October 11, only 2.9 million barrels of crude oil were transported through the waterways, the lowest record for the month. Although subsequent satellite imagery tracking may revise this data upwards, the 7-day average shipment volume is already about 43% lower than pre-conflict levels. Shipowners' evasive behavior has led to ships turning around from anchorages in the Gulf of Oman, with some tankers diverting to relatively safer areas such as the Gulf of Mexico to load cargo. The detours and ship-to-ship transshipments caused by the conflict have extended the effective turnaround time of ships by several days, thus shrinking the available global tanker capacity. Analysis shows that longer routes and transshipment operations have boosted tanker demand by about 13%. This sharp drop in shipment volume, coupled with the contraction in capacity, has increased market concerns about short-term supply continuity.Record daily earnings for supertankers
Data from shipping brokerage firms shows that the average daily earnings of very large crude carriers (VLCCs) worldwide reached a record high of $805,000 on October 9th. Longer routes and ship-to-ship transshipment are the main factors driving up demand. High freight rates reflect both shipowners' risk premium requirements and changes in the actual landed cost structure of crude oil. Some shipowners are choosing to load cargo in the Gulf of Mexico, taking advantage of the still relatively high freight rates in that region while avoiding risks around the Strait of Hormuz. This redistribution of cargo flows has alleviated supply pressure for some buyers in the short term, but it has also extended the overall transportation cycle, further tightening the supply and demand in the global tanker market. Both product tankers and crude oil tankers have been affected, leading to a simultaneous increase in freight rates on related routes.Brent crude oil daily chart technical pattern observation
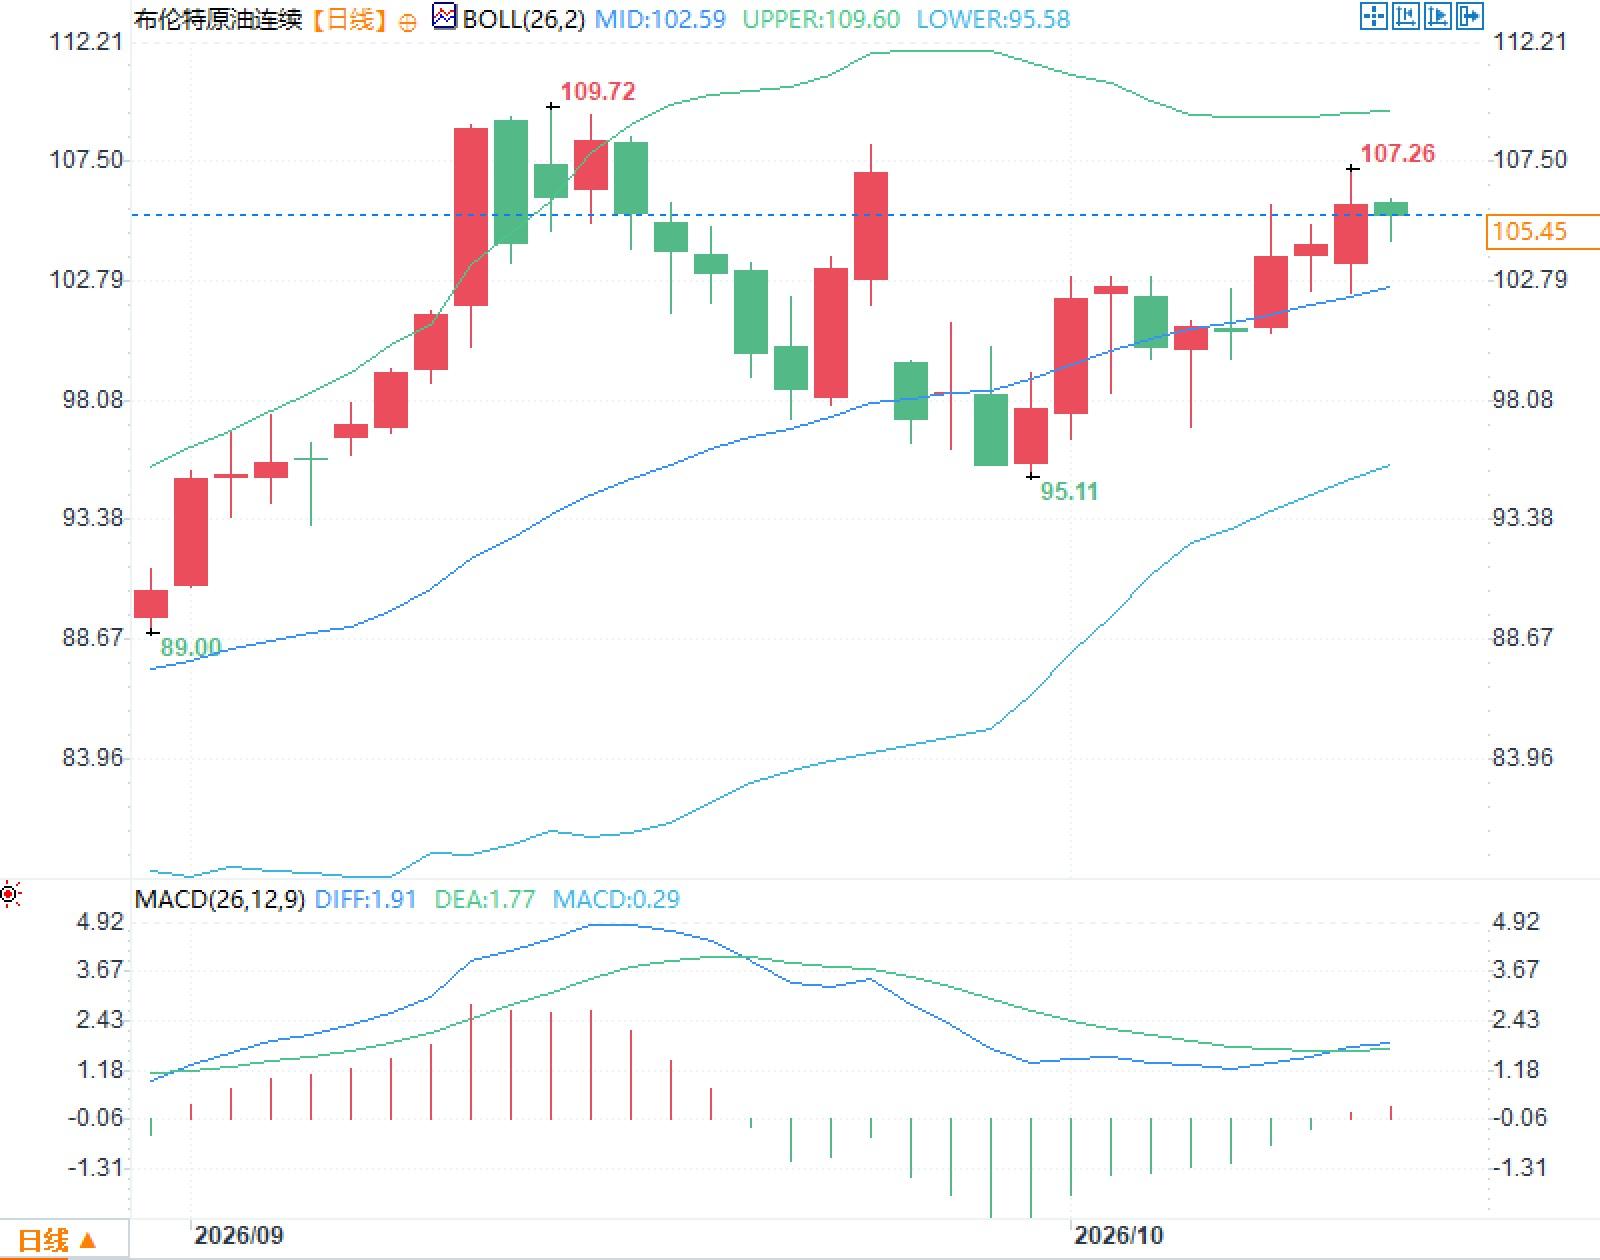
The Brent crude oil daily chart shows the Bollinger Bands with the middle band at $102.59/barrel, the upper band at $109.60/barrel, and the lower band at $95.58/barrel. The current price is trading above the middle band, with some room to move towards the upper band. The MACD indicator shows a DIFF value of 1.91, a DEA value of 1.77, and a histogram value of 0.29. The histogram values remain positive but the magnitude is limited, and the gap between DIFF and DEA is small. Recently, the price touched a high near $109.72/barrel before falling back, reaching a low near $95.11/barrel. The price is currently trading between the middle and upper Bollinger Bands, and volatility has increased compared to the previous period.Frequently Asked Questions
Question 1: Why is the number of ships attacked on October 11th considered a peak? Answer: Shipping monitoring agencies reported that six ships were attacked that day, the highest single-day record since the conflict began, and a cumulative total of 24 ships within two weeks, significantly exceeding the 13 ships attacked in early March, reflecting an increase in the intensity of attacks. Question 2: What are the main reasons for the decline in Gulf crude oil shipments from their September highs? Answer: The continuous attacks increased shipowners' willingness to avoid the area, with some ships turning back from anchorages, resulting in a sharp decrease in transit numbers. On October 11th, shipments dropped to 2.9 million barrels per day, and the seven-day average was about 43% lower than before the conflict. Question 3: What does the daily earnings of $805,000 for Very Large Crude Carriers (VLCCs) mean for the market? Answer: High freight rates reflect risk premiums and tight effective shipping capacity. Detours and transshipments increased demand by about 13%, raising actual landed costs, but did not change the underlying pricing logic of the benchmark price.- Risk Warning and Disclaimer
- The market involves risk, and trading may not be suitable for all investors. This article is for reference only and does not constitute personal investment advice, nor does it take into account certain users’ specific investment objectives, financial situation, or other needs. Any investment decisions made based on this information are at your own risk.