US inflation unexpectedly surged! Gold plummeted $34, and the market instantly changed its tune.
2026-10-14 20:42:19
On Wednesday (October 14th) at 8:30 PM Beijing time, the U.S. Department of Labor released the September Consumer Price Index (CPI). Data showed a year-on-year increase of 3.7%, higher than August's 3.4% and slightly exceeding the market's general expectation of 3.6%. This result quickly spread to the global asset pricing system. Before the data release, spot gold had risen by about $15, indicating that some funds held optimistic expectations of a decline in inflation; however, a reversal occurred after the release. The US dollar index rose by about 35 points in the short term, reaching a high of 102.54. U.S. Treasury yields rose across the board, with the 2-year yield seeing the largest increase, rising 3.83 basis points to 4.831%, the 10-year yield rising 1.47 basis points to 5.238%, and the 30-year yield rising 0.87 basis points to 5.572%. Short-term interest rate futures fell in tandem, with traders significantly increasing their bets on further tightening by the Federal Reserve. The increase in short-term yields was significantly greater than that of long-term yields, indicating a repricing of the yield curve. 
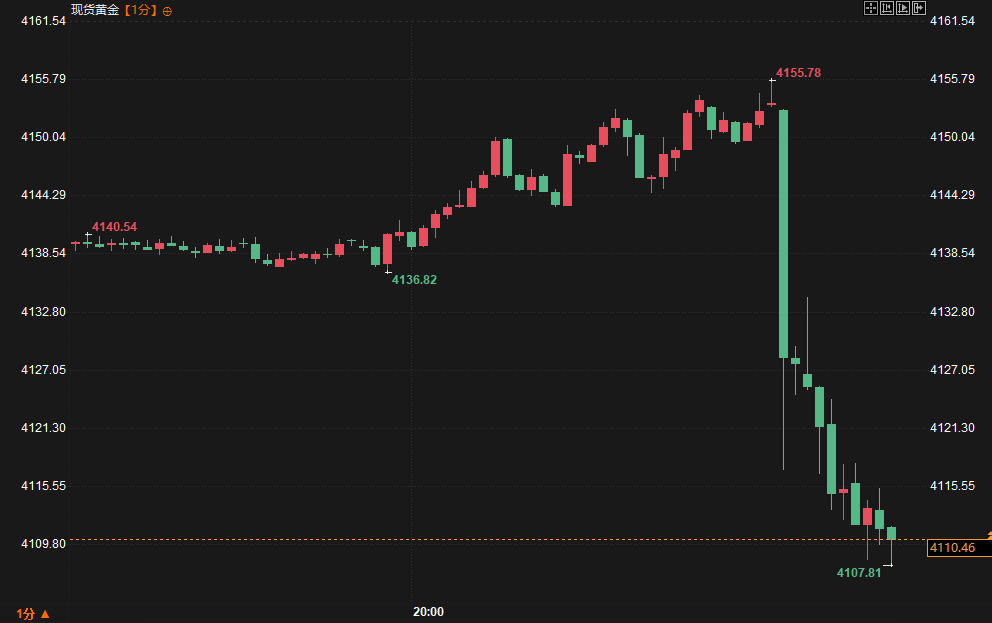
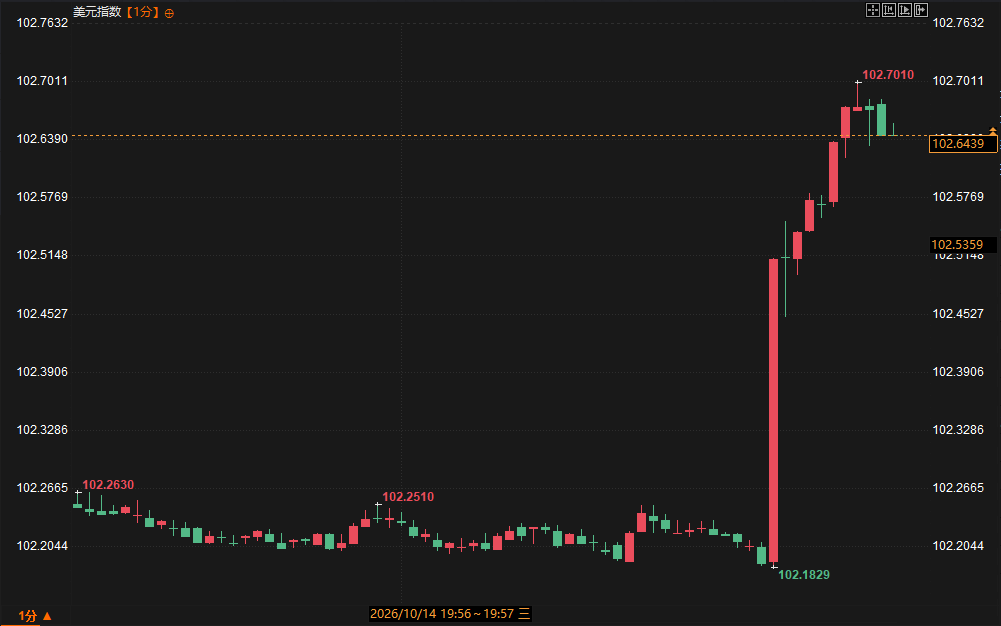 Looking at the yield curve, the spread between 2-year and 10-year yields remained positive at approximately 39.7 basis points, but the short-term rate saw a significantly larger increase, indicating that the market is more sensitive to the near-term policy path than to the long-term growth outlook. The decline in short-term interest rate futures further confirms traders' upward revision of the probability of a rate hike. The differing stances of well-known institutions before and after the data release were quite clear. Before the release, some large investment banks and macro research teams maintained a tone of "moderate inflation decline and one more rate hike this year, but at a controllable pace"; after the release, they quickly adjusted their statements, emphasizing that "the better-than-expected monthly figures reinforced the necessity of maintaining a restrictive policy stance," and pointing out that the price pressure on inputs such as semiconductors brought about by data center construction might reduce the efficiency of interest rate tools in transmitting to some sources of inflation. Retail investors showed more direct emotional fluctuations. Before the data release, many trading discussions focused on the technical rebound of gold and the potential for a dollar pullback; after the data release, discussions quickly shifted to "inflation resilience exceeding expectations and pressure on risk assets," with a significant increase in calls for short-term gold long positions to stop losses and for dollar long positions to follow suit. Institutional investors focused on reassessing policy paths and structural factors, while retail investors were more focused on immediate price fluctuations and position adjustments. The difference in their expected deviations formed a crucial micro-foundation for intraday market volatility. Historical comparisons show that similar unexpected inflation readings are often accompanied by a simultaneous rise in the US dollar and yields, as well as temporary pressure on gold. In the latest quotes, gold has fallen from its pre-data high to 4117, while the US dollar index has risen to around 102.50, a significant discrepancy from the price level expected under previous moderate conditions. The long-term and short-term logic remains consistent: short-term pricing quickly reflects policy repricing, while the medium-term outlook requires observation of whether subsequent inflation and employment data can verify the sustainability of this rebound.
Deep interconnect analysis
The core impact of this data lies in confirming that inflation stickiness persists. The year-on-year reading rebounded from 3.4% to 3.7%, exceeding not only the previous value but also the median expectation of economists surveyed by the Wall Street Journal. The market's immediate reaction exhibited typical "repricing" characteristics: the dollar strengthened, US Treasury yields rose, and gold prices plummeted by $34 from around $4151 to around $4117, a drop of approximately 1%. The pre-release rise in gold prices, contrasting sharply with the rapid decline after the data release, reflects how quickly the discrepancy between expectations and the actual result was digested. Looking at the yield curve, the spread between 2-year and 10-year yields remained positive at approximately 39.7 basis points, but the short-term rate saw a significantly larger increase, indicating that the market is more sensitive to the near-term policy path than to the long-term growth outlook. The decline in short-term interest rate futures further confirms traders' upward revision of the probability of a rate hike. The differing stances of well-known institutions before and after the data release were quite clear. Before the release, some large investment banks and macro research teams maintained a tone of "moderate inflation decline and one more rate hike this year, but at a controllable pace"; after the release, they quickly adjusted their statements, emphasizing that "the better-than-expected monthly figures reinforced the necessity of maintaining a restrictive policy stance," and pointing out that the price pressure on inputs such as semiconductors brought about by data center construction might reduce the efficiency of interest rate tools in transmitting to some sources of inflation. Retail investors showed more direct emotional fluctuations. Before the data release, many trading discussions focused on the technical rebound of gold and the potential for a dollar pullback; after the data release, discussions quickly shifted to "inflation resilience exceeding expectations and pressure on risk assets," with a significant increase in calls for short-term gold long positions to stop losses and for dollar long positions to follow suit. Institutional investors focused on reassessing policy paths and structural factors, while retail investors were more focused on immediate price fluctuations and position adjustments. The difference in their expected deviations formed a crucial micro-foundation for intraday market volatility. Historical comparisons show that similar unexpected inflation readings are often accompanied by a simultaneous rise in the US dollar and yields, as well as temporary pressure on gold. In the latest quotes, gold has fallen from its pre-data high to 4117, while the US dollar index has risen to around 102.50, a significant discrepancy from the price level expected under previous moderate conditions. The long-term and short-term logic remains consistent: short-term pricing quickly reflects policy repricing, while the medium-term outlook requires observation of whether subsequent inflation and employment data can verify the sustainability of this rebound.Trend Outlook
Market movements indicate that the market has already priced in the higher-than-expected September CPI figures. The performance of the US dollar index above 102.50, the relative strength of short-term US Treasury yields, and the pullback in gold from 4151 to 4117 collectively form the current immediate reaction framework. If inflation stickiness is further confirmed, short-term pressure on the yield curve may persist, and the inverse correlation between the dollar and gold will continue to dominate short-term volatility. If subsequent data shows signs of easing, some of the previously accumulated policy repricing may be reversed. Overall, the market logic has shifted from "expected decline" to "confirmation of resilience," and the relative strength of assets will continue to evolve around this shift.Further Reading
Q: What are the main market implications of the September CPI rising to 3.7% year-on-year? A: This figure was higher than both the previous value and expectations, reinforcing the perception that inflation remains sticky. The market therefore revised upward the probability of the Federal Reserve maintaining a restrictive policy, directly reflected in a stronger dollar, higher short-term US Treasury yields, and a decline in gold prices. Q: Why did the short-term US Treasury yield rise significantly more than the long-term yield? A: The short-term yield is more sensitive to expectations of the near-term policy path. After the data exceeded expectations, traders increased their bets on interest rate hikes, causing short-term interest rate futures to fall, resulting in a significant increase in the 2-year yield. The long-term yield, however, reflected more growth and long-term inflation expectations, with a relatively moderate adjustment. Q: Why did gold prices reverse significantly before and after the data release? A: Gold prices rose by about $15 before the release, reflecting some funds betting on a decline in inflation; after the release, the better-than-expected result triggered repricing, and gold prices quickly fell by $34, reflecting that the expectation deviation was immediately digested. Q: Where do the main differences lie between the views of well-known institutions and retail investors? A: Institutions focus more on the reassessment of the policy path and structural price pressures, while retail investors focus more directly on immediate price fluctuations and position reactions. The first two data points indicate a general consensus on a moderate decline, while the latter shifted the focus to emphasizing the necessity of a restrictive stance, and retail investors concentrated on adjusting their long and short positions. Q: What does this data mean for the correlation between the US dollar index and US Treasury yields? A: The simultaneous rise of approximately 35 points in the US dollar index and the across-the-board increase in US Treasury yields shows that the market has reached a consensus on risk appetite and policy pricing, with higher short-term interest rates further supporting the short-term performance of the US dollar.- Risk Warning and Disclaimer
- The market involves risk, and trading may not be suitable for all investors. This article is for reference only and does not constitute personal investment advice, nor does it take into account certain users’ specific investment objectives, financial situation, or other needs. Any investment decisions made based on this information are at your own risk.