Crude oil trading alert: After a continuous rebound, US crude oil prices have retreated slightly and are expected to remain in a high-level consolidation phase in the short term.
2026-10-16 10:04:21
WTI crude oil rose sharply by 3.03% to $97.97 per barrel in the previous trading session, while Brent crude oil fell by 0.13% to $105.92 per barrel. The performance of WTI crude was significantly stronger than Brent crude, primarily due to a substantial reduction in U.S. domestic inventories, while Brent crude was more suppressed by IEA reserve releases and shipping policy expectations.  Trump stated on Friday that he would not deploy US ground troops to Iran. This statement significantly reduced market expectations for a direct military conflict between the US and Iran in the short term, causing WTI crude oil prices to give back some of their gains in Asian trading. However, geopolitical risks in the Middle East have not been completely eliminated. The US Central Command confirmed that the Singaporean container ship that sank in the Strait of Hormuz this week was hit by an Iranian projectile. Although more than 40 ships passed through the Strait of Hormuz in the past 24 hours, and shipping has not been completely disrupted, tanker freight rates remain at historically high levels, and the risk of physical supply persists. EIA inventory data became the core driver of yesterday's surge in oil prices. For the week ending October 9, US commercial crude oil inventories decreased by 8.557 million barrels to 415.6 million barrels, far exceeding the market's previous expectation of a decrease of about 288,000 barrels, marking the largest weekly decline since February. Distillate fuel inventories decreased by 2.5 million barrels to 102.6 million barrels, falling to a historical low for the same period, about 12% lower than the five-year average. Gasoline inventories unexpectedly increased by 3.5 million barrels to 208.3 million barrels, reflecting a marginal weakening of gasoline demand. This unexpected reduction in inventories was mainly due to the impact of Hurricane Isaias—more than 70% of crude oil production in the Gulf of Mexico was temporarily shut down, and imports decreased by approximately 790,000 barrels per day. However, most of the affected production capacity resumed operation on Wednesday, and the short-term supply shock from the hurricane is subsiding. IEA reserve releases have somewhat dampened market sentiment, but the actual impact is limited. On Thursday, the IEA confirmed that member countries will accelerate the release of the remaining 100 million barrels of the 400 million barrels of reserves pledged in March, including the release of 20 million barrels of diesel "as soon as possible." However, the market generally believes that this is not new intervention, but rather an acceleration of existing commitments, and the scale is insufficient to fundamentally alleviate the diesel shortage. At the same time, the United States is considering easing sanctions on "shadow fleets" to reduce global freight rates, and Russia has also stated that diesel exports could be shipped in as little as two to three weeks. These potential incremental supplies are putting additional pressure on Brent crude and are also an important reason for the narrowing of the WTI-Brent price spread. From a technical perspective, WTI crude oil prices reached a high near $98 after six consecutive days of gains, leading to short-term profit-taking. The daily chart shows a pivot point at $95.04/barrel, corresponding to a maximum support/resistance range of $91.93 to $98.20/barrel. Currently, the price is trading above the pivot point, indicating that bulls still dominate, but it's approaching the upper limit of the range, and further upward movement requires increased trading volume. Regarding the moving average system, short-term moving averages continue to diverge upwards, and the price has stabilized above the 20-day moving average, maintaining the medium-term trend structure. However, the MACD indicator shows signs of convergence in the red bars above the zero line, with the gap between the fast and slow lines narrowing, indicating a weakening of upward momentum and a technical correction after the continuous rise. The RSI reading is around 62, in the neutral-to-strong zone but not yet in overbought territory, suggesting further upside potential but with short-term momentum trending towards equilibrium. As for the Bollinger Bands, the price has pulled back after touching the upper band, and the Bollinger Bands have slightly widened, reflecting increased volatility. If the price can regain above $97.50, it may test the $98.00 to $100.00 psychological level; if it falls below the middle band, it may retrace to the $93.00 to $92.00 area to seek support. From the 4-hour chart, oil prices are consolidating at high levels within an upward channel, with short-term moving averages flattening. The MACD shows initial bearish momentum but has not yet formed a valid death cross, a typical "overbought and digested" pattern. Fibonacci retracement indicates that $93.84 (0.618 Fibonacci retracement level) is a key support, while the upper edge of the trading range around $97.50 (the previous downward gap) is a significant resistance. A break below $93.84 could open up downside potential to $92.00 or even $90.50; a break above $97.50 with significant volume could test the $98.00 to $100.00 area.
 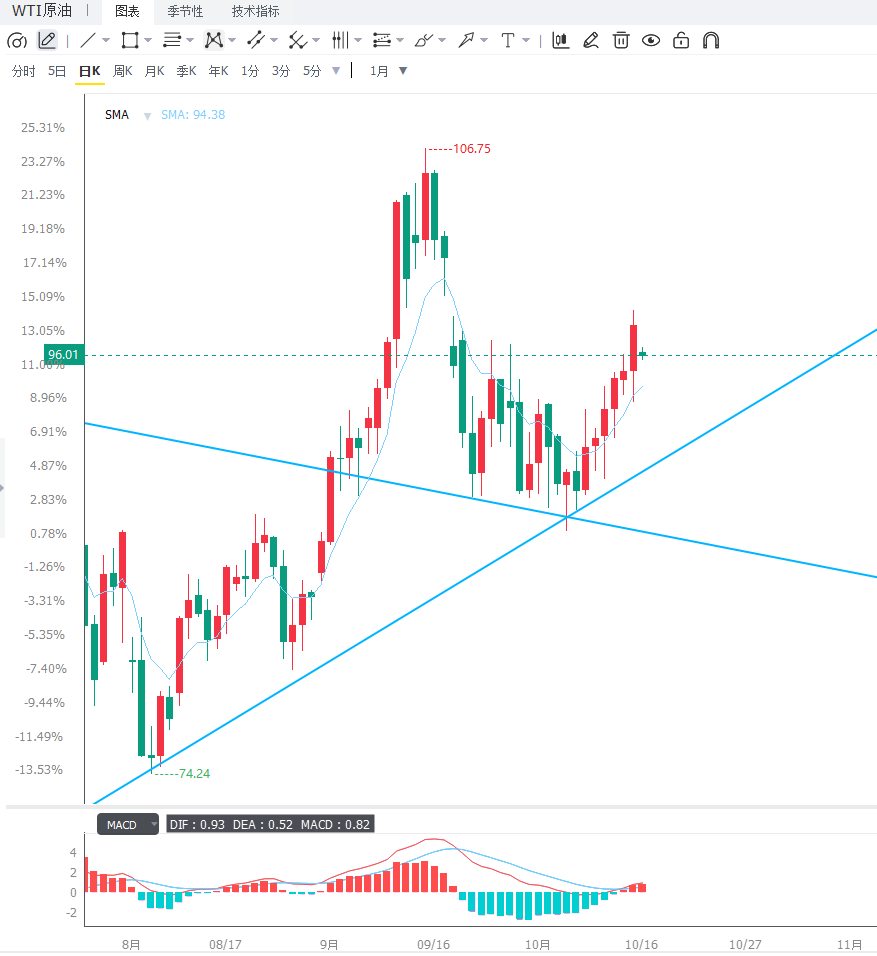 The editor summarizes that WTI crude oil is currently caught in a tug-of-war between "geopolitical risk premium support" and "policy supply increase suppression." Trump's statements have temporarily eased concerns about a direct conflict between the US and Iran, but shipping risks in the Strait of Hormuz, the unexpectedly low EIA inventory levels, and the tight diesel supply continue to provide bottom support for oil prices. IEA reserve releases and expectations of easing sanctions on shadow fleets are putting downward pressure on Brent crude, but have a limited impact on WTI. The short-term direction depends on whether the situation in the Middle East escalates further, the progress of production recovery in the Gulf of Mexico after the hurricane, and whether there are any new policy changes before the US midterm elections next week. Before the resistance zone of $98 to $100 is effectively broken, the overall structure will remain dominated by high-level fluctuations, but the risk of a breakout to the upside due to unforeseen geopolitical events should be closely monitored.
Trump stated on Friday that he would not deploy US ground troops to Iran. This statement significantly reduced market expectations for a direct military conflict between the US and Iran in the short term, causing WTI crude oil prices to give back some of their gains in Asian trading. However, geopolitical risks in the Middle East have not been completely eliminated. The US Central Command confirmed that the Singaporean container ship that sank in the Strait of Hormuz this week was hit by an Iranian projectile. Although more than 40 ships passed through the Strait of Hormuz in the past 24 hours, and shipping has not been completely disrupted, tanker freight rates remain at historically high levels, and the risk of physical supply persists. EIA inventory data became the core driver of yesterday's surge in oil prices. For the week ending October 9, US commercial crude oil inventories decreased by 8.557 million barrels to 415.6 million barrels, far exceeding the market's previous expectation of a decrease of about 288,000 barrels, marking the largest weekly decline since February. Distillate fuel inventories decreased by 2.5 million barrels to 102.6 million barrels, falling to a historical low for the same period, about 12% lower than the five-year average. Gasoline inventories unexpectedly increased by 3.5 million barrels to 208.3 million barrels, reflecting a marginal weakening of gasoline demand. This unexpected reduction in inventories was mainly due to the impact of Hurricane Isaias—more than 70% of crude oil production in the Gulf of Mexico was temporarily shut down, and imports decreased by approximately 790,000 barrels per day. However, most of the affected production capacity resumed operation on Wednesday, and the short-term supply shock from the hurricane is subsiding. IEA reserve releases have somewhat dampened market sentiment, but the actual impact is limited. On Thursday, the IEA confirmed that member countries will accelerate the release of the remaining 100 million barrels of the 400 million barrels of reserves pledged in March, including the release of 20 million barrels of diesel "as soon as possible." However, the market generally believes that this is not new intervention, but rather an acceleration of existing commitments, and the scale is insufficient to fundamentally alleviate the diesel shortage. At the same time, the United States is considering easing sanctions on "shadow fleets" to reduce global freight rates, and Russia has also stated that diesel exports could be shipped in as little as two to three weeks. These potential incremental supplies are putting additional pressure on Brent crude and are also an important reason for the narrowing of the WTI-Brent price spread. From a technical perspective, WTI crude oil prices reached a high near $98 after six consecutive days of gains, leading to short-term profit-taking. The daily chart shows a pivot point at $95.04/barrel, corresponding to a maximum support/resistance range of $91.93 to $98.20/barrel. Currently, the price is trading above the pivot point, indicating that bulls still dominate, but it's approaching the upper limit of the range, and further upward movement requires increased trading volume. Regarding the moving average system, short-term moving averages continue to diverge upwards, and the price has stabilized above the 20-day moving average, maintaining the medium-term trend structure. However, the MACD indicator shows signs of convergence in the red bars above the zero line, with the gap between the fast and slow lines narrowing, indicating a weakening of upward momentum and a technical correction after the continuous rise. The RSI reading is around 62, in the neutral-to-strong zone but not yet in overbought territory, suggesting further upside potential but with short-term momentum trending towards equilibrium. As for the Bollinger Bands, the price has pulled back after touching the upper band, and the Bollinger Bands have slightly widened, reflecting increased volatility. If the price can regain above $97.50, it may test the $98.00 to $100.00 psychological level; if it falls below the middle band, it may retrace to the $93.00 to $92.00 area to seek support. From the 4-hour chart, oil prices are consolidating at high levels within an upward channel, with short-term moving averages flattening. The MACD shows initial bearish momentum but has not yet formed a valid death cross, a typical "overbought and digested" pattern. Fibonacci retracement indicates that $93.84 (0.618 Fibonacci retracement level) is a key support, while the upper edge of the trading range around $97.50 (the previous downward gap) is a significant resistance. A break below $93.84 could open up downside potential to $92.00 or even $90.50; a break above $97.50 with significant volume could test the $98.00 to $100.00 area. The editor summarizes that WTI crude oil is currently caught in a tug-of-war between "geopolitical risk premium support" and "policy supply increase suppression." Trump's statements have temporarily eased concerns about a direct conflict between the US and Iran, but shipping risks in the Strait of Hormuz, the unexpectedly low EIA inventory levels, and the tight diesel supply continue to provide bottom support for oil prices. IEA reserve releases and expectations of easing sanctions on shadow fleets are putting downward pressure on Brent crude, but have a limited impact on WTI. The short-term direction depends on whether the situation in the Middle East escalates further, the progress of production recovery in the Gulf of Mexico after the hurricane, and whether there are any new policy changes before the US midterm elections next week. Before the resistance zone of $98 to $100 is effectively broken, the overall structure will remain dominated by high-level fluctuations, but the risk of a breakout to the upside due to unforeseen geopolitical events should be closely monitored.
- Risk Warning and Disclaimer
- The market involves risk, and trading may not be suitable for all investors. This article is for reference only and does not constitute personal investment advice, nor does it take into account certain users’ specific investment objectives, financial situation, or other needs. Any investment decisions made based on this information are at your own risk.