Soaring oil prices reinforced expectations of a Federal Reserve rate hike, causing gold to break through key support and hit a more than two-month low.
2026-10-23 10:00:22
On Friday morning in Asia, spot gold traded around $4,000 per ounce, continuing its recent weakness and accelerating its decline. The core contradiction in gold prices lies in the fact that the safe-haven demand driven by geopolitical conflicts and rising oil prices is completely suppressed by the stronger logic chain of "rising oil prices → rising inflation → central bank tightening." As a result, gold has not only failed to benefit from this round of geopolitical escalation but has also been sold off, exhibiting typical characteristics of "ineffective safe-haven demand and interest rate dominance."  From a suppressive perspective, rising energy costs are reshaping the market's pricing dynamics. The Houthi rebels claimed responsibility for an attack on an airport in eastern Saudi Arabia on Wednesday evening. Such attacks extend disruption risks from single chokepoints to ports, airports, and processing facilities, causing Brent crude to rebound to near a five-month high of around $110. However, high energy costs increase the likelihood that the US central bank will need to further adjust monetary policy to curb price pressures. When inflation is driven by supply shocks, gold's anti-inflation narrative is often overshadowed by tightening expectations—investors buy gold to hedge against inflation while also bearing the holding costs of rising real interest rates, which have clearly prevailed in this round of pricing. This is the fundamental reason why gold prices have remained weak amid geopolitical tensions. On the monetary policy front, there are no signs of a shift in the tightening path. The Federal Reserve decided to raise interest rates last month, its first move since 2023, and the market widely expects further tightening later this year. Federal Reserve Chairman Warsh avoided signaling the outcome of this month's policy meeting last week, but emphasized that higher-than-expected inflation has not changed his assessment of the US economy. According to the CME FedWatch tool, the probability of keeping interest rates unchanged at the October meeting is currently around 92.8%. While a hold-up next week is widely expected, the path of continued tightening at the end of the year has not been disproven, keeping the policy outlook still skewed towards tightening. Higher interest rates typically put downward pressure on gold, as precious metals do not pay interest, making them relatively attractive as interest-bearing assets. For gold, this is a combination of "lack of dovish catalysts in the short term and unresolved interest rate pressures in the medium term": as long as the year-end tightening path remains unproven, every rebound in gold prices is likely to be met with profit-taking. Policy communication has also failed to provide any clues of a shift. Warsh's recent speeches scored 5.6/10, slightly below the historical average of 6.1/10, indicating that his communication was more moderate than usual, but the overall tone remained cautious. He acknowledged that he was "deeply traumatized by the global financial crisis," highlighting a continued wariness of financial stability despite emphasizing structural growth and a surge in investment driven by "good policies." He also viewed artificial intelligence as a short-term demand shock (its impact on employment remains uncertain) and declined to predict decisions in October and December. The FXS Fed Sentiment Index remained unchanged at a high of 127.51, well above the neutral benchmark. This means that despite the lack of incremental signals in his speech, the overall policy narrative remains firmly in the hawkish range, which the market should interpret as a framework of "high easing thresholds." For gold, this constitutes a persistent headwind: as long as the index remains above 127 and the year-end tightening path is not disproven, the central level of real interest rates is unlikely to systematically decline, thus limiting the upside potential for gold prices. From a cross-asset perspective, the current fluctuations in gold prices are essentially the superposition of two independent logics: on one hand, the increased demand for safe-haven assets due to shipping disruptions and the spread of attacks in the Middle East, coupled with central bank gold purchases and ETF holdings providing structural support for gold prices; on the other hand, if oil prices continue to rise, they will further push up global inflation figures through cost channels (Deutsche Bank has already warned that the market may be pricing in a period of high oil prices extending into 2027), forcing central banks to extend the high-interest-rate cycle, which in turn will negatively impact precious metal valuations through the real interest rate channel. Therefore, it is inappropriate to simply equate geopolitical tensions with a bullish outlook for gold. Instead, attention should be paid to the actual direction of real interest rates and the US dollar—only when inflation expectations diverge from real interest rates, or when the US dollar weakens again due to reduced yield support, will the pricing power of gold truly materialize. On the daily chart, spot gold is trading below the 20-day Bollinger Band middle line and the 100-day simple moving average. Moving averages and volatility resistance are densely distributed above the price, suppressing any rebound and further deepening the medium-term bearish structure. The RSI (14) is around 35, just above the oversold zone, indicating that downward momentum is still being released but may slow down as the indicator overextends, a typical "weak bottoming, nearing oversold" pattern. The upper resistance levels to watch are the lower Bollinger Band at approximately $4055, the 20-day Bollinger Band middle line at approximately $4150, and the broad supply zone formed by the 100-day moving average at approximately $4230 and the upper Bollinger Band at approximately $4245. Only a decisive break above $4055 on the daily chart can alleviate the current bearish bias. The first support level to watch is the psychological level of $4,000, followed by the June lows of $3,960-$3,940, with further support at $3,830 (as indicated by Societe Generale). $4,000 is a key psychological support level; a break below this level could open up further downside towards $3,940. On the 4-hour chart, gold prices have been slowly declining along short-term moving averages after falling from around $4,060. The MACD histogram is expanding below the zero line, with the fast and slow lines diverging downwards, indicating short-term bearish dominance. Currently, the price is oscillating narrowly between $4,000 and $4,045. A significant break below $4,000 could lead to support at $3,980 or even $3,960-$3,940. An upward breakout would require a decline in real interest rates or a substantial escalation in geopolitical tensions. Until then, a range-bound trading strategy is advisable, avoiding chasing highs and lows.
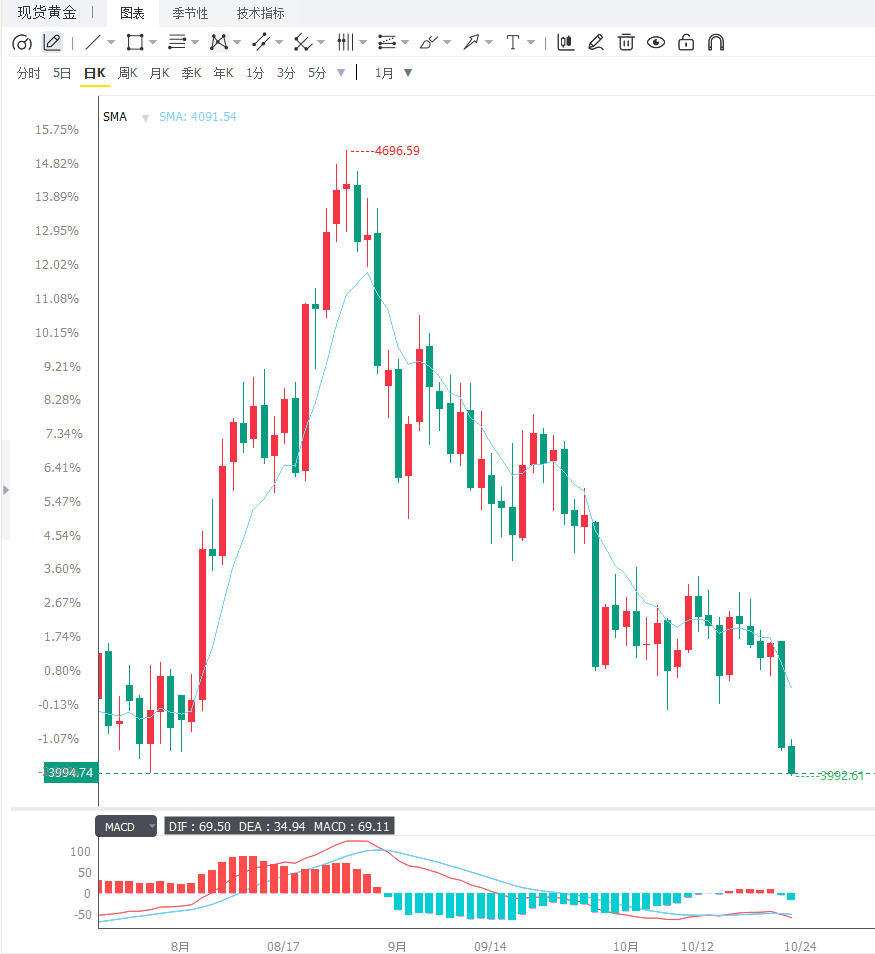 Editor's Summary: The core contradiction for gold in the short term lies in the surge in oil prices reinforcing inflation and interest rate hike expectations, coupled with technical selling pressure triggered by the breach of the key support level of $4065. The combined effect of these two factors suggests that gold prices are more likely to repeatedly test the bottom within the $3960-$4055 range. Three variables need to be closely monitored going forward: first, the navigation status of the Strait of Hormuz and the frequency of attacks within Saudi Arabia, which directly determine the duration of safe-haven demand, but it should be noted that its boosting effect is being suppressed by interest rate logic; second, US inflation data and the Fed's year-end policy path. If tightening expectations continue to rise, real interest rate pressures will push gold prices to test $3940 or even $3830; third, the direction of the US dollar index and US Treasury real yields, which are key indicators of whether gold can gain support in terms of pricing. In the medium term, before $4055 is effectively recovered, gold prices will maintain a weak and volatile pattern. Confirmation of the trend direction still depends on the tone set by inflation data and the final clarity of the central bank's year-end policy path.
From a suppressive perspective, rising energy costs are reshaping the market's pricing dynamics. The Houthi rebels claimed responsibility for an attack on an airport in eastern Saudi Arabia on Wednesday evening. Such attacks extend disruption risks from single chokepoints to ports, airports, and processing facilities, causing Brent crude to rebound to near a five-month high of around $110. However, high energy costs increase the likelihood that the US central bank will need to further adjust monetary policy to curb price pressures. When inflation is driven by supply shocks, gold's anti-inflation narrative is often overshadowed by tightening expectations—investors buy gold to hedge against inflation while also bearing the holding costs of rising real interest rates, which have clearly prevailed in this round of pricing. This is the fundamental reason why gold prices have remained weak amid geopolitical tensions. On the monetary policy front, there are no signs of a shift in the tightening path. The Federal Reserve decided to raise interest rates last month, its first move since 2023, and the market widely expects further tightening later this year. Federal Reserve Chairman Warsh avoided signaling the outcome of this month's policy meeting last week, but emphasized that higher-than-expected inflation has not changed his assessment of the US economy. According to the CME FedWatch tool, the probability of keeping interest rates unchanged at the October meeting is currently around 92.8%. While a hold-up next week is widely expected, the path of continued tightening at the end of the year has not been disproven, keeping the policy outlook still skewed towards tightening. Higher interest rates typically put downward pressure on gold, as precious metals do not pay interest, making them relatively attractive as interest-bearing assets. For gold, this is a combination of "lack of dovish catalysts in the short term and unresolved interest rate pressures in the medium term": as long as the year-end tightening path remains unproven, every rebound in gold prices is likely to be met with profit-taking. Policy communication has also failed to provide any clues of a shift. Warsh's recent speeches scored 5.6/10, slightly below the historical average of 6.1/10, indicating that his communication was more moderate than usual, but the overall tone remained cautious. He acknowledged that he was "deeply traumatized by the global financial crisis," highlighting a continued wariness of financial stability despite emphasizing structural growth and a surge in investment driven by "good policies." He also viewed artificial intelligence as a short-term demand shock (its impact on employment remains uncertain) and declined to predict decisions in October and December. The FXS Fed Sentiment Index remained unchanged at a high of 127.51, well above the neutral benchmark. This means that despite the lack of incremental signals in his speech, the overall policy narrative remains firmly in the hawkish range, which the market should interpret as a framework of "high easing thresholds." For gold, this constitutes a persistent headwind: as long as the index remains above 127 and the year-end tightening path is not disproven, the central level of real interest rates is unlikely to systematically decline, thus limiting the upside potential for gold prices. From a cross-asset perspective, the current fluctuations in gold prices are essentially the superposition of two independent logics: on one hand, the increased demand for safe-haven assets due to shipping disruptions and the spread of attacks in the Middle East, coupled with central bank gold purchases and ETF holdings providing structural support for gold prices; on the other hand, if oil prices continue to rise, they will further push up global inflation figures through cost channels (Deutsche Bank has already warned that the market may be pricing in a period of high oil prices extending into 2027), forcing central banks to extend the high-interest-rate cycle, which in turn will negatively impact precious metal valuations through the real interest rate channel. Therefore, it is inappropriate to simply equate geopolitical tensions with a bullish outlook for gold. Instead, attention should be paid to the actual direction of real interest rates and the US dollar—only when inflation expectations diverge from real interest rates, or when the US dollar weakens again due to reduced yield support, will the pricing power of gold truly materialize. On the daily chart, spot gold is trading below the 20-day Bollinger Band middle line and the 100-day simple moving average. Moving averages and volatility resistance are densely distributed above the price, suppressing any rebound and further deepening the medium-term bearish structure. The RSI (14) is around 35, just above the oversold zone, indicating that downward momentum is still being released but may slow down as the indicator overextends, a typical "weak bottoming, nearing oversold" pattern. The upper resistance levels to watch are the lower Bollinger Band at approximately $4055, the 20-day Bollinger Band middle line at approximately $4150, and the broad supply zone formed by the 100-day moving average at approximately $4230 and the upper Bollinger Band at approximately $4245. Only a decisive break above $4055 on the daily chart can alleviate the current bearish bias. The first support level to watch is the psychological level of $4,000, followed by the June lows of $3,960-$3,940, with further support at $3,830 (as indicated by Societe Generale). $4,000 is a key psychological support level; a break below this level could open up further downside towards $3,940. On the 4-hour chart, gold prices have been slowly declining along short-term moving averages after falling from around $4,060. The MACD histogram is expanding below the zero line, with the fast and slow lines diverging downwards, indicating short-term bearish dominance. Currently, the price is oscillating narrowly between $4,000 and $4,045. A significant break below $4,000 could lead to support at $3,980 or even $3,960-$3,940. An upward breakout would require a decline in real interest rates or a substantial escalation in geopolitical tensions. Until then, a range-bound trading strategy is advisable, avoiding chasing highs and lows. Editor's Summary: The core contradiction for gold in the short term lies in the surge in oil prices reinforcing inflation and interest rate hike expectations, coupled with technical selling pressure triggered by the breach of the key support level of $4065. The combined effect of these two factors suggests that gold prices are more likely to repeatedly test the bottom within the $3960-$4055 range. Three variables need to be closely monitored going forward: first, the navigation status of the Strait of Hormuz and the frequency of attacks within Saudi Arabia, which directly determine the duration of safe-haven demand, but it should be noted that its boosting effect is being suppressed by interest rate logic; second, US inflation data and the Fed's year-end policy path. If tightening expectations continue to rise, real interest rate pressures will push gold prices to test $3940 or even $3830; third, the direction of the US dollar index and US Treasury real yields, which are key indicators of whether gold can gain support in terms of pricing. In the medium term, before $4055 is effectively recovered, gold prices will maintain a weak and volatile pattern. Confirmation of the trend direction still depends on the tone set by inflation data and the final clarity of the central bank's year-end policy path.
- Risk Warning and Disclaimer
- The market involves risk, and trading may not be suitable for all investors. This article is for reference only and does not constitute personal investment advice, nor does it take into account certain users’ specific investment objectives, financial situation, or other needs. Any investment decisions made based on this information are at your own risk.