Liquidation panic overshadows US Treasury rebound, gold price teetering at $4,000 mark.
2026-10-23 19:48:22
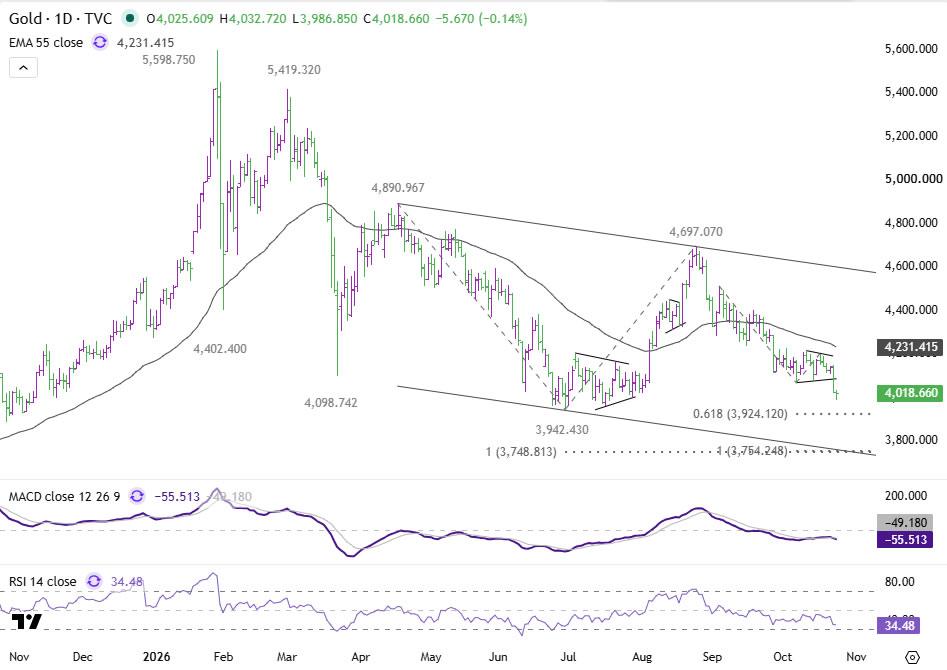
The recent decline in gold prices has exposed a rare divergence in performance among traditional safe-haven assets. A tech-driven stock sell-off prompted funds to flow into US Treasuries, pushing the 10-year Treasury yield down by about 17 basis points to 4.96%, but gold prices continued to weaken, briefly falling below $4,000. Inflation-adjusted real yields on US Treasuries also declined; however, the expected support for gold prices from lower real interest rates failed to materialize.  This contrast suggests that the impact of liquidity and position pressures has outweighed gold's traditional sensitivity to interest rates; however, there is currently no independent evidence to confirm a forced market liquidation. Technically, the break below $4066.21 signifies the resumption of the downtrend that began at $4697.07, potentially entering its fifth wave. The primary support level to watch is $3942–$3924, where a preliminary rebound is possible. However, a decisive break below this range would target the $3750 area. Support around 25803 for the Nasdaq Composite Index and whether the US 10-year Treasury yield can hold below 5% are crucial indicators of whether this round of asset class safe-haven adjustments will worsen or stabilize. Despite a significant decline in US Treasury yields, gold prices continued to fall . On Thursday, a sell-off in tech stocks intensified, extending gold's decline. It briefly dipped below the psychological level of $4000, reaching a daily low near $3986. Silver saw an even larger drop, dragged down by market concerns about industrial demand and economic growth prospects. The contrast between the weakening of precious metals and the strengthening of US Treasuries is striking: safe-haven buying has poured into Treasuries, pushing yields down significantly. This divergence is particularly noteworthy: while nominal yields on US Treasuries have fallen, real interest rates have also declined. The yield on the 10-year nominal US Treasury note fell from approximately 5.13% to 4.96%, corresponding to an inflation-adjusted real yield of 2.76% to 2.64%. Typically, lower real yields reduce the opportunity cost of holding non-interest-bearing assets like gold. However, gold has not benefited from this, indicating that short-term gold price movements have been dominated by other selling forces. The timing of this market movement is also noteworthy: the decline in gold prices began earlier than the rebound in US Treasuries, suggesting that the initial sell-off cannot be simply attributed to liquidity pressures from the subsequent stock market decline. Nevertheless, gold remains weak despite the decline in real yields, meaning that traditional interest rate pricing logic has lost its previous supportive effect. Selling in the AI sector spurs safe-haven buying of Treasuries Investors are beginning to question the scale of capital required for large-scale artificial intelligence investment and its potential returns, leading to another sharp drop in the US technology sector. On Thursday, the Nasdaq Composite Index fell approximately 2.6%, its biggest one-day drop since June; the S&P 500 fell approximately 1.2%. Semiconductor stocks, including Nvidia, led the decline, and the selling pressure on tech stocks had already spread to Asian and European tech markets. The market's core focus has shifted: from whether AI investments can drive revenue growth to whether massive capital expenditures can generate sufficient returns. Recent corporate earnings reports have not quelled this debate, and investors have become particularly sensitive to corporate investment guidance and funding needs. The weakness in tech stocks boosted market demand for safe-haven assets in US Treasuries, pushing down Treasury yields. The rise in US Treasuries reflects funds seeking safe-haven assets, but gold did not strengthen in tandem. This divergence indicates that investors are taking drastically different approaches to two types of assets: buying Treasuries as a safe haven while reducing other highly liquid positions to control overall portfolio risk exposure. This also suggests that this market reaction is not simply a reassessment of interest rate expectations. Why can't declining yields support gold prices? Liquidity-driven selling is a reasonable explanation for the unusual weakness in gold. When the stock market falls, leveraged investors face unrealized losses, margin calls, or tightened risk limits, requiring them to quickly raise cash. Gold, with its high liquidity, may be liquidated even if its long-term investment value remains. HSBC has pointed out that forced margin liquidation weakens gold's short-term hedging effect against stock market declines; Invesco also warns that during periods of financial stress, investors will sell profitable gold holdings to meet liquidity needs. The current price movement aligns with this logic: both nominal and real yields on US Treasury bonds have fallen, but gold and tech stocks have weakened in tandem. A break below technical support could trigger further selling, amplifying the decline. However, the scale of the forced selling cannot be verified at present. Real-time data on ETF fund flows, futures trading, and margin-related data are insufficient to determine the proportion of leveraged fund liquidations that contributed to Thursday's gold price drop. Looking at previous speculative positions, data from the U.S. Commodity Futures Trading Commission (CFTC) shows that as of October 13, asset management institutions' net long positions in COMEX gold futures decreased from approximately 127,400 contracts at the end of September to 107,100 contracts. This indicates that long positions were already shrinking before this round of sharp declines. However, this statistic does not include Thursday's trading data, so it cannot be confirmed whether subsequent liquidations accelerated. Existing evidence leans towards the interpretation that liquidity and position pressures temporarily overwhelmed the favorable interest rate environment for gold; it cannot prove that forced liquidation was the dominant factor in this round of declines. Technical Analysis: Gold Initiates Fifth Wave Decline, Target $3924 Gold prices broke below the $4066.21 support level, confirming the resumption of the downtrend from the high of $4697.07. According to the current wave structure, the decline that began at $4198.93 is the fifth wave decline after a failed rebound. The 4-hour and daily charts show downward pressure, with the price trading below the 55-period exponential moving average (4-hour EMA around $4124, daily EMA around $4231).
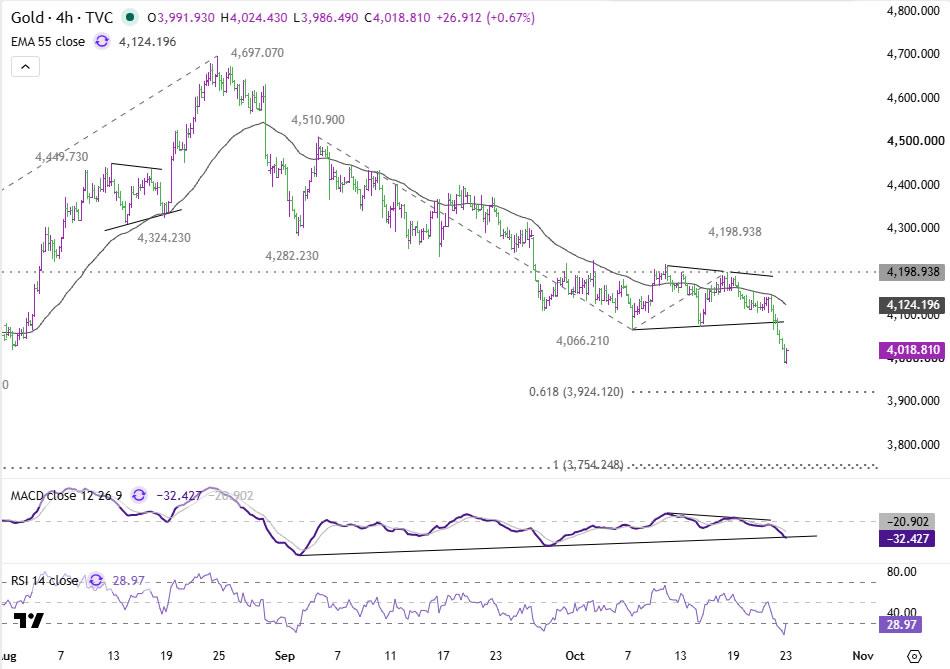 (Spot Gold 4-Hour Chart) First Downside Target: Starting from $4198.93, the 61.8% Fibonacci extension of the $4510.90–$4066.21 range, at $3924.12. This level is slightly lower than the previous low of $3942.43, together forming a key support zone of $3924–$3942. The 4-hour Relative Strength Index (RSI) is close to 29, indicating oversold momentum, so a temporary rebound in gold prices in this area is not unexpected. However, as long as the resistance at $4198.93 cannot be broken, the short-term trend remains bearish. If gold prices effectively break below $3924.12, the decline will accelerate, targeting the 100% extension level at $3754.24. This level highly coincides with the daily large-scale extension target of $3748–$3749 and the lower rail of the medium-term descending channel. The convergence of multiple technical levels suggests that $3,748–$3,754 is a potentially significant bottoming area, provided that the current downtrend continues to this level.
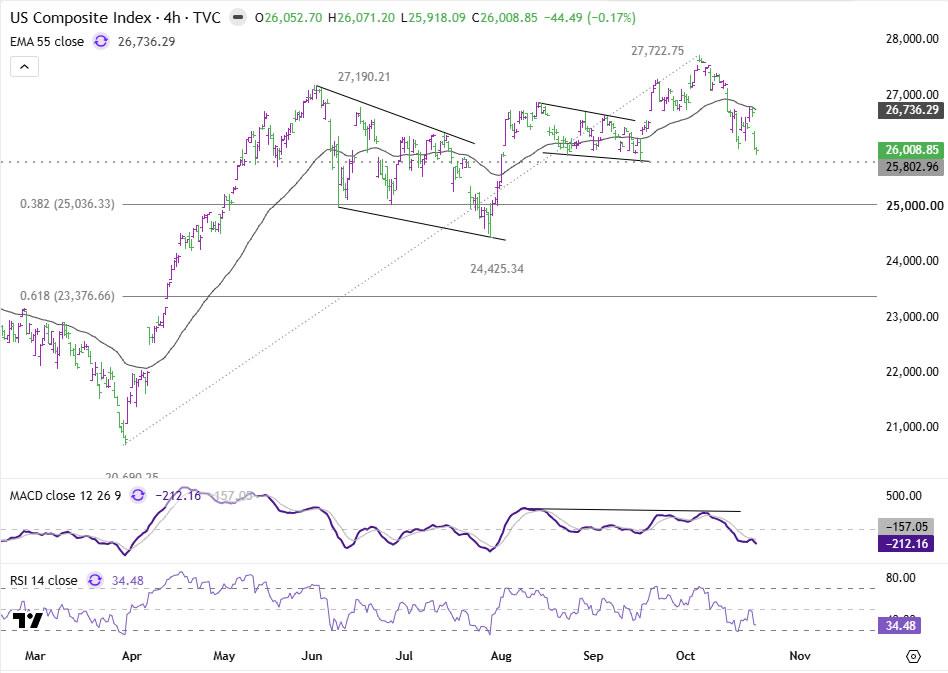
 (Spot Gold Daily Chart) Nasdaq and US Treasury Yields: A Cross-Asset Perspective for Assessing Market Pressure Two indicators outside the gold market can help determine whether the market pressure behind the current decline continues to worsen. On Thursday, the Nasdaq fell to 26009 points, approaching the key structural support level of 25802.96 points. A sustained break below this level would indicate a continuation of the stock market decline, with the next target being the 38.2% Fibonacci retracement level of the upward move from 20690.25 to 27722.75, approximately 25036.35 points. Further weakness in the stock market will amplify the pressure to downgrade portfolios, but a simple technical breakdown does not necessarily trigger a new round of forced liquidation.
 (10-year US Treasury yield 4-hour chart) Meanwhile, the US 10-year Treasury yield has fallen back to around 4.975%, near the 55-period EMA on the daily chart, breaking below the psychological level of 5%. If the yield continues to decline, the next target is the 38.2% Fibonacci retracement level of the 3.926%–5.365% upward move, around 4.815%. Conversely, if the yield rises back above 5%, coupled with a stabilizing stock market, it suggests that safe-haven buying of Treasuries may subside.
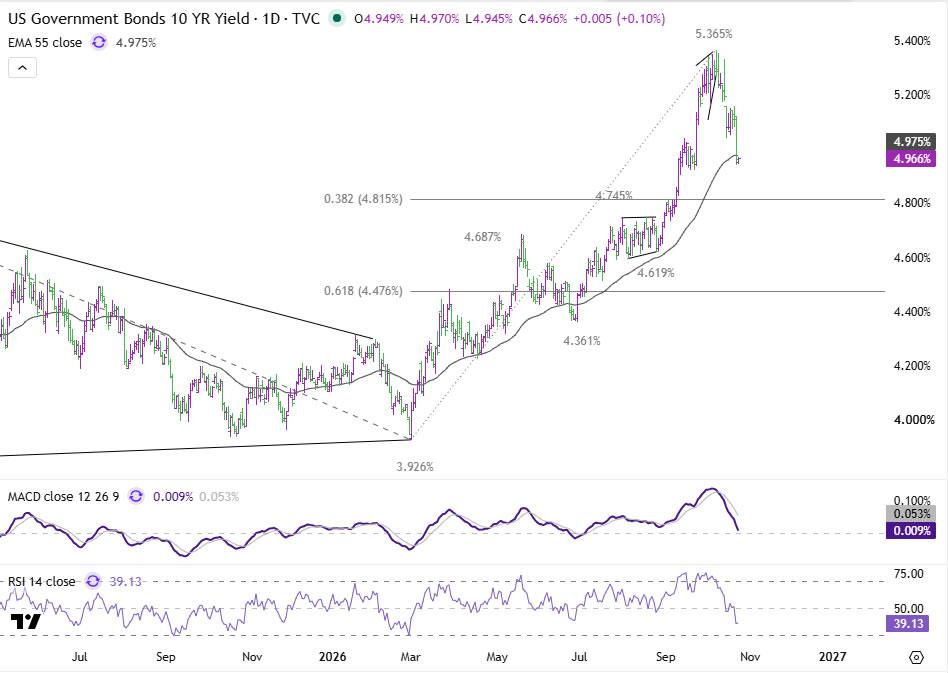 (Daily chart of 10-year US Treasury yield) The most alarming combination signal: the Nasdaq breaks below support while US Treasury yields continue to decline. If gold continues to weaken under these circumstances, it further confirms that liquidity and holding pressures are overriding the traditional interest rate pricing logic for gold. Conversely, if the stock market stabilizes and safe-haven buying of US Treasuries cools, the short-term momentum for safe-haven adjustments in major asset classes will weaken, and the selling pressure on gold is expected to ease. Currently, the inability of declining real yields to boost gold prices remains the core market signal. The specific scale of leverage liquidation is still uncertain; after the technical breakdown, the market is closely watching the $3924 support level. If the sell-off continues to accelerate, the risk of gold prices falling further to $3748-$3754 will increase significantly.
This contrast suggests that the impact of liquidity and position pressures has outweighed gold's traditional sensitivity to interest rates; however, there is currently no independent evidence to confirm a forced market liquidation. Technically, the break below $4066.21 signifies the resumption of the downtrend that began at $4697.07, potentially entering its fifth wave. The primary support level to watch is $3942–$3924, where a preliminary rebound is possible. However, a decisive break below this range would target the $3750 area. Support around 25803 for the Nasdaq Composite Index and whether the US 10-year Treasury yield can hold below 5% are crucial indicators of whether this round of asset class safe-haven adjustments will worsen or stabilize. Despite a significant decline in US Treasury yields, gold prices continued to fall . On Thursday, a sell-off in tech stocks intensified, extending gold's decline. It briefly dipped below the psychological level of $4000, reaching a daily low near $3986. Silver saw an even larger drop, dragged down by market concerns about industrial demand and economic growth prospects. The contrast between the weakening of precious metals and the strengthening of US Treasuries is striking: safe-haven buying has poured into Treasuries, pushing yields down significantly. This divergence is particularly noteworthy: while nominal yields on US Treasuries have fallen, real interest rates have also declined. The yield on the 10-year nominal US Treasury note fell from approximately 5.13% to 4.96%, corresponding to an inflation-adjusted real yield of 2.76% to 2.64%. Typically, lower real yields reduce the opportunity cost of holding non-interest-bearing assets like gold. However, gold has not benefited from this, indicating that short-term gold price movements have been dominated by other selling forces. The timing of this market movement is also noteworthy: the decline in gold prices began earlier than the rebound in US Treasuries, suggesting that the initial sell-off cannot be simply attributed to liquidity pressures from the subsequent stock market decline. Nevertheless, gold remains weak despite the decline in real yields, meaning that traditional interest rate pricing logic has lost its previous supportive effect. Selling in the AI sector spurs safe-haven buying of Treasuries Investors are beginning to question the scale of capital required for large-scale artificial intelligence investment and its potential returns, leading to another sharp drop in the US technology sector. On Thursday, the Nasdaq Composite Index fell approximately 2.6%, its biggest one-day drop since June; the S&P 500 fell approximately 1.2%. Semiconductor stocks, including Nvidia, led the decline, and the selling pressure on tech stocks had already spread to Asian and European tech markets. The market's core focus has shifted: from whether AI investments can drive revenue growth to whether massive capital expenditures can generate sufficient returns. Recent corporate earnings reports have not quelled this debate, and investors have become particularly sensitive to corporate investment guidance and funding needs. The weakness in tech stocks boosted market demand for safe-haven assets in US Treasuries, pushing down Treasury yields. The rise in US Treasuries reflects funds seeking safe-haven assets, but gold did not strengthen in tandem. This divergence indicates that investors are taking drastically different approaches to two types of assets: buying Treasuries as a safe haven while reducing other highly liquid positions to control overall portfolio risk exposure. This also suggests that this market reaction is not simply a reassessment of interest rate expectations. Why can't declining yields support gold prices? Liquidity-driven selling is a reasonable explanation for the unusual weakness in gold. When the stock market falls, leveraged investors face unrealized losses, margin calls, or tightened risk limits, requiring them to quickly raise cash. Gold, with its high liquidity, may be liquidated even if its long-term investment value remains. HSBC has pointed out that forced margin liquidation weakens gold's short-term hedging effect against stock market declines; Invesco also warns that during periods of financial stress, investors will sell profitable gold holdings to meet liquidity needs. The current price movement aligns with this logic: both nominal and real yields on US Treasury bonds have fallen, but gold and tech stocks have weakened in tandem. A break below technical support could trigger further selling, amplifying the decline. However, the scale of the forced selling cannot be verified at present. Real-time data on ETF fund flows, futures trading, and margin-related data are insufficient to determine the proportion of leveraged fund liquidations that contributed to Thursday's gold price drop. Looking at previous speculative positions, data from the U.S. Commodity Futures Trading Commission (CFTC) shows that as of October 13, asset management institutions' net long positions in COMEX gold futures decreased from approximately 127,400 contracts at the end of September to 107,100 contracts. This indicates that long positions were already shrinking before this round of sharp declines. However, this statistic does not include Thursday's trading data, so it cannot be confirmed whether subsequent liquidations accelerated. Existing evidence leans towards the interpretation that liquidity and position pressures temporarily overwhelmed the favorable interest rate environment for gold; it cannot prove that forced liquidation was the dominant factor in this round of declines. Technical Analysis: Gold Initiates Fifth Wave Decline, Target $3924 Gold prices broke below the $4066.21 support level, confirming the resumption of the downtrend from the high of $4697.07. According to the current wave structure, the decline that began at $4198.93 is the fifth wave decline after a failed rebound. The 4-hour and daily charts show downward pressure, with the price trading below the 55-period exponential moving average (4-hour EMA around $4124, daily EMA around $4231). (Spot Gold 4-Hour Chart) First Downside Target: Starting from $4198.93, the 61.8% Fibonacci extension of the $4510.90–$4066.21 range, at $3924.12. This level is slightly lower than the previous low of $3942.43, together forming a key support zone of $3924–$3942. The 4-hour Relative Strength Index (RSI) is close to 29, indicating oversold momentum, so a temporary rebound in gold prices in this area is not unexpected. However, as long as the resistance at $4198.93 cannot be broken, the short-term trend remains bearish. If gold prices effectively break below $3924.12, the decline will accelerate, targeting the 100% extension level at $3754.24. This level highly coincides with the daily large-scale extension target of $3748–$3749 and the lower rail of the medium-term descending channel. The convergence of multiple technical levels suggests that $3,748–$3,754 is a potentially significant bottoming area, provided that the current downtrend continues to this level. (Spot Gold Daily Chart) Nasdaq and US Treasury Yields: A Cross-Asset Perspective for Assessing Market Pressure Two indicators outside the gold market can help determine whether the market pressure behind the current decline continues to worsen. On Thursday, the Nasdaq fell to 26009 points, approaching the key structural support level of 25802.96 points. A sustained break below this level would indicate a continuation of the stock market decline, with the next target being the 38.2% Fibonacci retracement level of the upward move from 20690.25 to 27722.75, approximately 25036.35 points. Further weakness in the stock market will amplify the pressure to downgrade portfolios, but a simple technical breakdown does not necessarily trigger a new round of forced liquidation. (10-year US Treasury yield 4-hour chart) Meanwhile, the US 10-year Treasury yield has fallen back to around 4.975%, near the 55-period EMA on the daily chart, breaking below the psychological level of 5%. If the yield continues to decline, the next target is the 38.2% Fibonacci retracement level of the 3.926%–5.365% upward move, around 4.815%. Conversely, if the yield rises back above 5%, coupled with a stabilizing stock market, it suggests that safe-haven buying of Treasuries may subside. (Daily chart of 10-year US Treasury yield) The most alarming combination signal: the Nasdaq breaks below support while US Treasury yields continue to decline. If gold continues to weaken under these circumstances, it further confirms that liquidity and holding pressures are overriding the traditional interest rate pricing logic for gold. Conversely, if the stock market stabilizes and safe-haven buying of US Treasuries cools, the short-term momentum for safe-haven adjustments in major asset classes will weaken, and the selling pressure on gold is expected to ease. Currently, the inability of declining real yields to boost gold prices remains the core market signal. The specific scale of leverage liquidation is still uncertain; after the technical breakdown, the market is closely watching the $3924 support level. If the sell-off continues to accelerate, the risk of gold prices falling further to $3748-$3754 will increase significantly.
- Risk Warning and Disclaimer
- The market involves risk, and trading may not be suitable for all investors. This article is for reference only and does not constitute personal investment advice, nor does it take into account certain users’ specific investment objectives, financial situation, or other needs. Any investment decisions made based on this information are at your own risk.