Soaring oil prices reignite inflation concerns, gold falls below $4,000 to hit a new low since July.
2026-10-26 10:06:24
On Monday morning in Asia, spot gold traded around $3,990, extending its overnight decline of over 2.5% and repeatedly testing the $4,000 level. The core contradiction in gold prices lies in the fact that while escalating geopolitical tensions should traditionally be a boon for gold, this round of conflict has primarily impacted the energy sector, leading to inflation and tightening expectations that have instead become headwinds for gold. This combination of "geopolitical benefits offset by interest rate headwinds" explains why gold prices have fallen instead of risen during this round of Middle East tensions, hitting a new low since July.  From the perspective of suppressing factors, oil prices are the most direct transmission channel. WTI crude oil rose to a more than five-month high, while Brent crude also strengthened, due to concerns about further disruptions to energy supplies triggered by Houthi attacks on Saudi Arabia. OCBC strategists pointed out that gold "faced renewed selling pressure overnight, falling more than 2.5%", while "Brent oil prices surged amid renewed concerns about Middle East supply, exacerbating inflation worries and expectations that the Federal Reserve may need to maintain interest rates for longer", thus putting pressure on metals. The logic of this chain is very clear: rising oil prices push up inflation readings on the cost side, thereby strengthening the central bank's rationale for maintaining high interest rates; since gold does not earn interest, the upward shift in the real interest rate center will directly increase its holding cost, making interest-bearing assets relatively more attractive. Compared with previous geopolitical events, the pricing focus of this conflict has fallen on the inflation side rather than the safe-haven side, which is the fundamental reason why gold has failed to replicate its previous safe-haven performance. What is even more alarming is the reaction pattern of gold prices. OCBC specifically pointed out that "even with a sharp drop in US Treasury yields, gold is still weakening," and emphasized that "neither lower yields nor escalating geopolitical uncertainty are sufficient to support gold prices, indicating that recent market sentiment remains fragile." This observation has key implications: in traditional pricing frameworks, declining yields and the outbreak of risk events usually constitute dual support for gold; when both conditions are met and gold prices still fall, it indicates that the dominant force has shifted from marginal positive factors to passive selling based on positioning and sentiment. Combined with the large sell-off by CTAs, it can be seen that the current decline is driven more by algorithmic selling and leveraged long position liquidation than by fundamental repricing. This type of sell-off is characterized by its speed and low elasticity—once key psychological levels are breached, it easily triggers the next stop-loss order, but it is also more likely to see a technical rebound after the panic subsides. Policy expectations, on the other hand, limit the upside potential. Although traders believe that the probability of a 25 basis point rate hike at next week's policy meeting is low, rising oil prices have prompted the market to increase its bets on another rate hike in December. According to the CME FedWatch tool, the market is currently pricing in a 79.4% probability of a Fed rate hike in December and a 90.6% probability of keeping rates unchanged at this month's meeting. Fed Chairman Warsh's recent speeches received a 5.6/10 rating, slightly below the historical average of 6.1/10, indicating a relatively dovish but still cautious tone. He acknowledged being "deeply wounded by the global financial crisis," emphasized the surge in investment driven by "good policy," and remained wary of the uncertainty surrounding the impact of AI on employment, while refusing to predict the October and December decisions. The FXS Fed Sentiment Index remained unchanged at a high of 127.51, indicating that the overall policy narrative remains firmly in the hawkish range. For gold, this is an environment of "no short-term catalysts and medium-term headwinds": no change next week is widely expected, making it difficult to provide additional bullish momentum; however, the year-end tightening path has not been disproven, making any rebound vulnerable to selling pressure at relatively low levels. The most uncertain variable remains geopolitics itself. Trump stated over the weekend that it was "time to make a decision" regarding whether to reach an agreement with Tehran or resume strikes, while threats from Iran and the Houthis continued to escalate. This "negotiation door open, military option in hand" middle ground is precisely the scenario most difficult to price for gold: it neither disproves the risk of supply disruptions nor provides a clear path to mitigation, ultimately leaving gold unsatisfied—it fails to attract pure safe-haven buying and cannot escape inflation-induced deflationary concerns. Only when this situation moves to one side will the pricing center of gold become clear again. Institutional views further confirm the current cautious stance. OCBC stated, "Given gold's lack of positive reaction to recent yield declines, we remain cautious in the short term," noting that "falling oil prices and further declines in real yields may help gold stabilize," but emphasizing that "we will not turn to a more optimistic attitude in the short term until we see a better price response." From a cross-asset perspective, the current volatility in gold is essentially a confluence of four factors: first, the proactive suppression exerted by soaring oil prices through inflation and interest rate channels; second, passive selling pressure caused by outflows of programmatic funds such as CTAs; third, the valuation ceiling created by the fact that the Fed's year-end rate hike path has not been disproven; and fourth, the pricing failure due to geopolitical tensions not translating into effective safe-haven buying. Furthermore, the phenomenon of silver falling below $54 to a new low since November 2025 and the passive increase in the gold-silver ratio further confirms that the market's pricing focus remains on interest rates rather than inflation. Investors should not view the unilateral movement of gold in isolation, but rather assess it within the transmission chain of "oil prices—inflation—real interest rates—exchange rates": only when real interest rates or the dollar index show substantial easing will the temporary bottom of gold prices have credibility. On the daily chart, spot gold is trading below the 100-day simple moving average and the 20-day Bollinger Band middle line, with the price below the lower Bollinger Band. The recent break below the channel indicates significant downward pressure, suggesting a short-term bearish bias. The RSI (14) is at 34.13, hovering near the oversold zone, indicating that selling pressure still dominates, but the indicator is nearing overextend, a typical "bearish trend, nearing oversold" pattern. It is advisable to wait for confirmation signals rather than blindly shorting. The upper resistance levels to watch are the lower Bollinger Band at approximately $4015, the 20-day Bollinger Band middle line at approximately $4130, and the broad supply zone formed by the 100-day moving average at approximately $4220 and the upper Bollinger Band at approximately $4240. Only a decisive break above $4015 on the daily chart can alleviate the current bearish bias and open up space for an upward move to $4130. The first support level to watch is the previous support at $3980, followed by the psychological levels of $3950 and $3900. $4000 is a key psychological level recently; a sustained close below this level could open up further downside potential towards $3950 and even $3900. On the 4-hour chart, gold prices have been slowly declining along short-term moving averages after falling from around $4020. The MACD histogram is expanding below the zero line, with the fast and slow lines diverging downwards, indicating short-term bearish dominance. A significant break below $3980 could lead to a test of support at $3950 and even $3900. An upward breakout would require a pullback in oil prices and a decline in real interest rates. Until then, a range-bound trading strategy is advisable, avoiding chasing highs and lows.
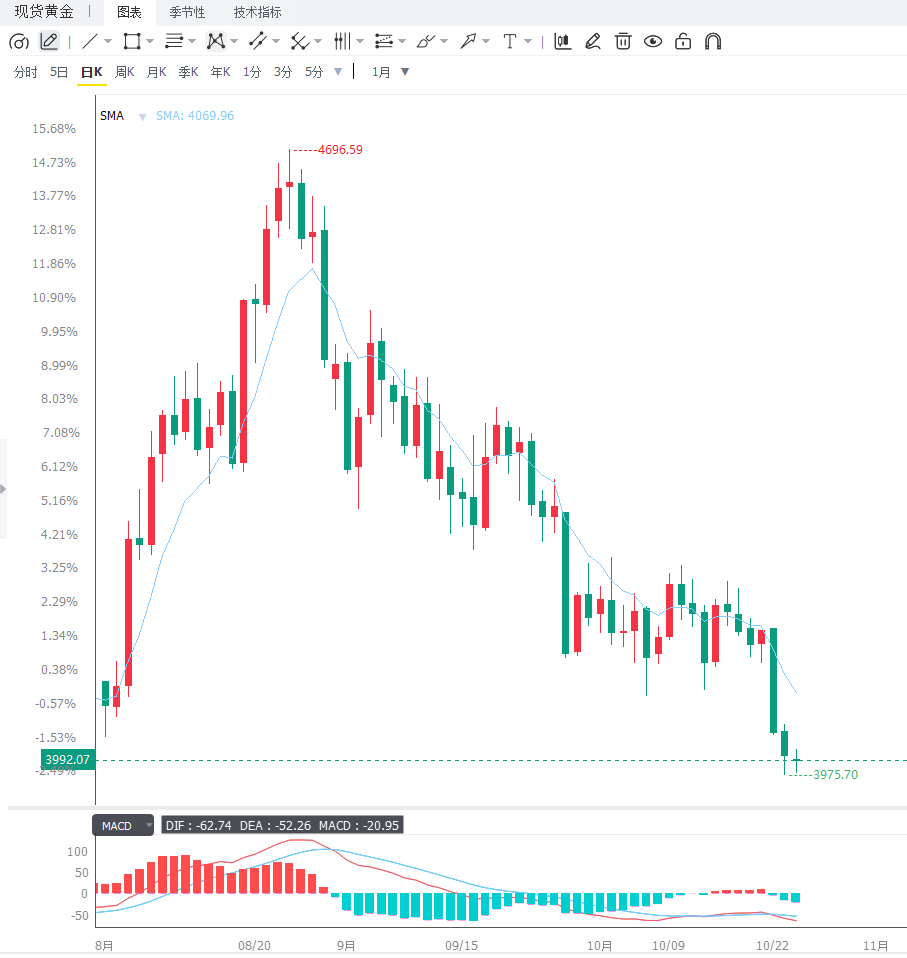 Editor's Summary: The core contradiction for gold in the short term lies in the renewed inflation and Fed tightening concerns fueled by soaring oil prices, compounded by CTA fund outflows and technical breakdowns putting pressure on prices. Meanwhile, the RSI approaching oversold levels and the $4000 mark acting as a buffer, these two forces suggest that gold prices are more likely to consolidate within the $3980-$4015 range, awaiting confirmation of a breakout. Going forward, three key variables need to be monitored: first, the trends of Brent and WTI crude oil and the passage of traffic in the Strait of Hormuz, which are prerequisites for determining inflation expectations and real interest rate trends; second, Trump's "decisive moment" statements regarding Iran and the extent of Iranian retaliation, any substantial escalation or de-escalation could potentially reprice gold prices through both safe-haven demand and oil price movements; and third, the outcome of this month's Fed meeting and the confirmation of the December path, coupled with US inflation data and the dollar index trend, will be key indicators for determining year-end holding costs.
From the perspective of suppressing factors, oil prices are the most direct transmission channel. WTI crude oil rose to a more than five-month high, while Brent crude also strengthened, due to concerns about further disruptions to energy supplies triggered by Houthi attacks on Saudi Arabia. OCBC strategists pointed out that gold "faced renewed selling pressure overnight, falling more than 2.5%", while "Brent oil prices surged amid renewed concerns about Middle East supply, exacerbating inflation worries and expectations that the Federal Reserve may need to maintain interest rates for longer", thus putting pressure on metals. The logic of this chain is very clear: rising oil prices push up inflation readings on the cost side, thereby strengthening the central bank's rationale for maintaining high interest rates; since gold does not earn interest, the upward shift in the real interest rate center will directly increase its holding cost, making interest-bearing assets relatively more attractive. Compared with previous geopolitical events, the pricing focus of this conflict has fallen on the inflation side rather than the safe-haven side, which is the fundamental reason why gold has failed to replicate its previous safe-haven performance. What is even more alarming is the reaction pattern of gold prices. OCBC specifically pointed out that "even with a sharp drop in US Treasury yields, gold is still weakening," and emphasized that "neither lower yields nor escalating geopolitical uncertainty are sufficient to support gold prices, indicating that recent market sentiment remains fragile." This observation has key implications: in traditional pricing frameworks, declining yields and the outbreak of risk events usually constitute dual support for gold; when both conditions are met and gold prices still fall, it indicates that the dominant force has shifted from marginal positive factors to passive selling based on positioning and sentiment. Combined with the large sell-off by CTAs, it can be seen that the current decline is driven more by algorithmic selling and leveraged long position liquidation than by fundamental repricing. This type of sell-off is characterized by its speed and low elasticity—once key psychological levels are breached, it easily triggers the next stop-loss order, but it is also more likely to see a technical rebound after the panic subsides. Policy expectations, on the other hand, limit the upside potential. Although traders believe that the probability of a 25 basis point rate hike at next week's policy meeting is low, rising oil prices have prompted the market to increase its bets on another rate hike in December. According to the CME FedWatch tool, the market is currently pricing in a 79.4% probability of a Fed rate hike in December and a 90.6% probability of keeping rates unchanged at this month's meeting. Fed Chairman Warsh's recent speeches received a 5.6/10 rating, slightly below the historical average of 6.1/10, indicating a relatively dovish but still cautious tone. He acknowledged being "deeply wounded by the global financial crisis," emphasized the surge in investment driven by "good policy," and remained wary of the uncertainty surrounding the impact of AI on employment, while refusing to predict the October and December decisions. The FXS Fed Sentiment Index remained unchanged at a high of 127.51, indicating that the overall policy narrative remains firmly in the hawkish range. For gold, this is an environment of "no short-term catalysts and medium-term headwinds": no change next week is widely expected, making it difficult to provide additional bullish momentum; however, the year-end tightening path has not been disproven, making any rebound vulnerable to selling pressure at relatively low levels. The most uncertain variable remains geopolitics itself. Trump stated over the weekend that it was "time to make a decision" regarding whether to reach an agreement with Tehran or resume strikes, while threats from Iran and the Houthis continued to escalate. This "negotiation door open, military option in hand" middle ground is precisely the scenario most difficult to price for gold: it neither disproves the risk of supply disruptions nor provides a clear path to mitigation, ultimately leaving gold unsatisfied—it fails to attract pure safe-haven buying and cannot escape inflation-induced deflationary concerns. Only when this situation moves to one side will the pricing center of gold become clear again. Institutional views further confirm the current cautious stance. OCBC stated, "Given gold's lack of positive reaction to recent yield declines, we remain cautious in the short term," noting that "falling oil prices and further declines in real yields may help gold stabilize," but emphasizing that "we will not turn to a more optimistic attitude in the short term until we see a better price response." From a cross-asset perspective, the current volatility in gold is essentially a confluence of four factors: first, the proactive suppression exerted by soaring oil prices through inflation and interest rate channels; second, passive selling pressure caused by outflows of programmatic funds such as CTAs; third, the valuation ceiling created by the fact that the Fed's year-end rate hike path has not been disproven; and fourth, the pricing failure due to geopolitical tensions not translating into effective safe-haven buying. Furthermore, the phenomenon of silver falling below $54 to a new low since November 2025 and the passive increase in the gold-silver ratio further confirms that the market's pricing focus remains on interest rates rather than inflation. Investors should not view the unilateral movement of gold in isolation, but rather assess it within the transmission chain of "oil prices—inflation—real interest rates—exchange rates": only when real interest rates or the dollar index show substantial easing will the temporary bottom of gold prices have credibility. On the daily chart, spot gold is trading below the 100-day simple moving average and the 20-day Bollinger Band middle line, with the price below the lower Bollinger Band. The recent break below the channel indicates significant downward pressure, suggesting a short-term bearish bias. The RSI (14) is at 34.13, hovering near the oversold zone, indicating that selling pressure still dominates, but the indicator is nearing overextend, a typical "bearish trend, nearing oversold" pattern. It is advisable to wait for confirmation signals rather than blindly shorting. The upper resistance levels to watch are the lower Bollinger Band at approximately $4015, the 20-day Bollinger Band middle line at approximately $4130, and the broad supply zone formed by the 100-day moving average at approximately $4220 and the upper Bollinger Band at approximately $4240. Only a decisive break above $4015 on the daily chart can alleviate the current bearish bias and open up space for an upward move to $4130. The first support level to watch is the previous support at $3980, followed by the psychological levels of $3950 and $3900. $4000 is a key psychological level recently; a sustained close below this level could open up further downside potential towards $3950 and even $3900. On the 4-hour chart, gold prices have been slowly declining along short-term moving averages after falling from around $4020. The MACD histogram is expanding below the zero line, with the fast and slow lines diverging downwards, indicating short-term bearish dominance. A significant break below $3980 could lead to a test of support at $3950 and even $3900. An upward breakout would require a pullback in oil prices and a decline in real interest rates. Until then, a range-bound trading strategy is advisable, avoiding chasing highs and lows. Editor's Summary: The core contradiction for gold in the short term lies in the renewed inflation and Fed tightening concerns fueled by soaring oil prices, compounded by CTA fund outflows and technical breakdowns putting pressure on prices. Meanwhile, the RSI approaching oversold levels and the $4000 mark acting as a buffer, these two forces suggest that gold prices are more likely to consolidate within the $3980-$4015 range, awaiting confirmation of a breakout. Going forward, three key variables need to be monitored: first, the trends of Brent and WTI crude oil and the passage of traffic in the Strait of Hormuz, which are prerequisites for determining inflation expectations and real interest rate trends; second, Trump's "decisive moment" statements regarding Iran and the extent of Iranian retaliation, any substantial escalation or de-escalation could potentially reprice gold prices through both safe-haven demand and oil price movements; and third, the outcome of this month's Fed meeting and the confirmation of the December path, coupled with US inflation data and the dollar index trend, will be key indicators for determining year-end holding costs.
- Risk Warning and Disclaimer
- The market involves risk, and trading may not be suitable for all investors. This article is for reference only and does not constitute personal investment advice, nor does it take into account certain users’ specific investment objectives, financial situation, or other needs. Any investment decisions made based on this information are at your own risk.