













Iranian peace talks reduce the war premium, crude oil futures fall
2026-11-04 21:58:28
On Wednesday (November 4), both U.S. benchmark WTI crude oil and international benchmark Brent crude oil futures prices fell as traders awaited further developments in U.S.-Iran peace talks. Trading in the futures market remained within yesterday's wide-ranging fluctuations, indicating investor hesitation and uncertainty, and suggesting the market may be poised for significant volatility. Meanwhile, the Democrats won several victories in yesterday's midterm elections, regaining control of Congress. This could lead to a policy deadlock in the latter half of President Trump's four-year term.  Over the past two weeks, crude oil prices climbed to multi-month highs, with the market widely anticipating that Trump would escalate sanctions against Iran following the midterm elections. However, with negotiations progressing and rumors of significant concessions from Iran, traders anticipate a more substantial agreement. As a result, bullish traders began taking profits, and some of the war premium accumulated in the market diminished. December WTI crude oil futures daily technical analysis.
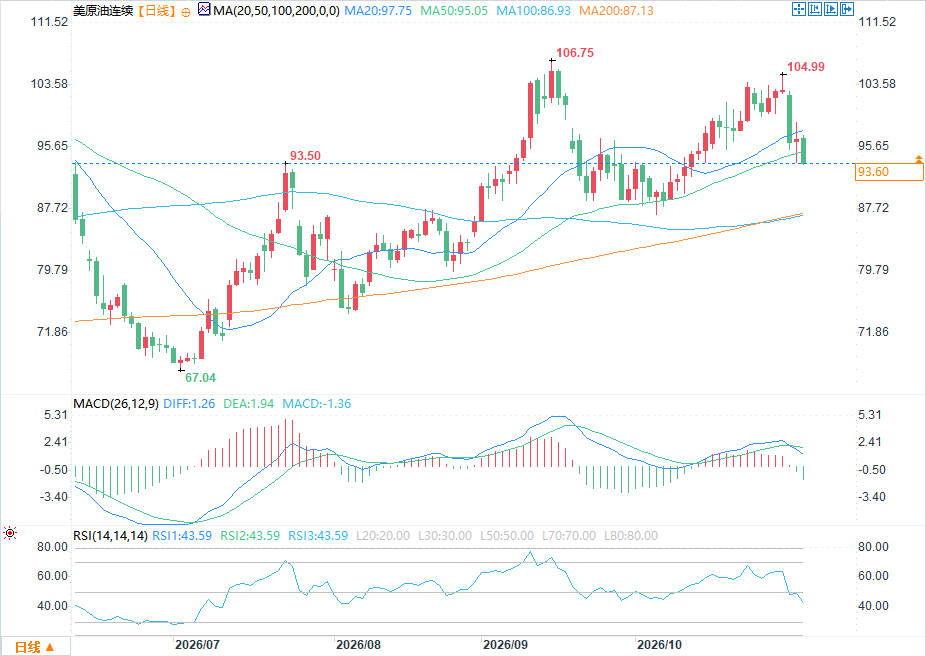 From the daily chart, the main market trend is upward. If the price breaks below $86.00, the main trend will turn downward; if it breaks above $104.99, it indicates a resumption of the upward trend. The retracement range formed by this fluctuation range is $95.50-$93.25. The secondary trend has turned downward. On Tuesday, sellers broke through the swing low of $95.25, turning the secondary trend bearish, and market momentum may shift to the downside. If a secondary fluctuation range of $104.99-$93.59 is formed, the corresponding retracement range of $99.29-$100.64 will become the next upside target. The intermediate fluctuation range is $77.18-$104.99, and the retracement range of $91.09-$87.80 is another potential downside target, followed by the long-term retracement range of $88.00-$83.98. The two retracement ranges overlap, forming a dense support zone at $88.00-$87.80. The current price action remains above the 50-day moving average; this level of $91.94 also provides support today, falling between the short-term 61.8% Fibonacci retracement level of $93.25 and the intermediate 50% retracement level of $91.09. A break above $104.99 could see the price test the historical highs of $106.75 and $107.77. January Brent crude oil futures daily technical analysis.
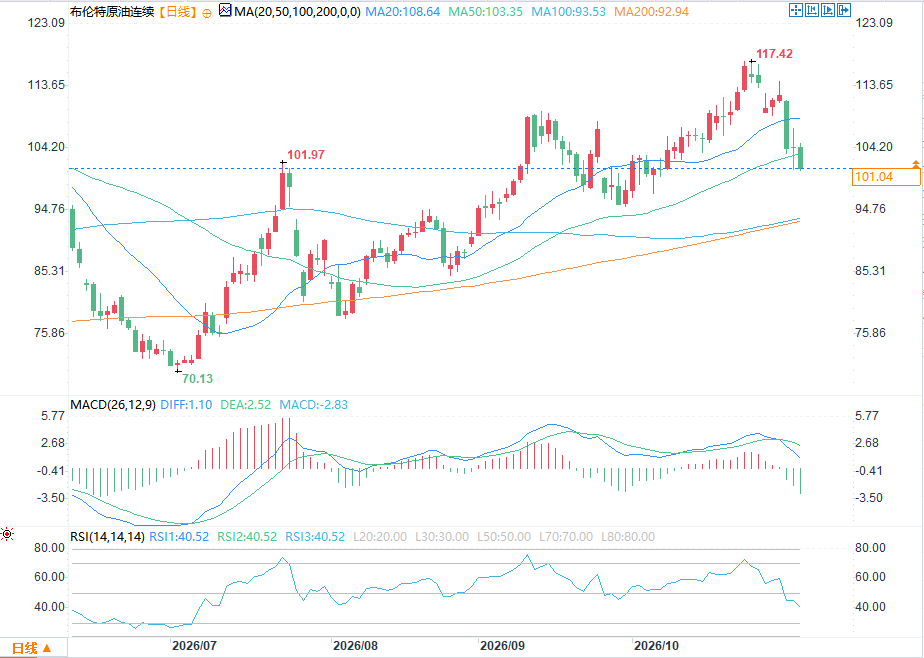 January Brent crude futures fell in early trading on Wednesday, but showed signs of attempting to establish new support. The daily chart shows the primary trend remains upward, but the secondary trend has turned bearish, with market momentum leaning towards declines. A break above $114.29 would confirm the continuation of the uptrend; a break below $92.64 would reverse the primary trend; and a break below $91.21 would further confirm the downtrend. The sell-off that began at $114.29 broke through the secondary lows of $109.02 and $101.12, pushing the secondary trend bearish. If prices continue to fall below $100.80, the next secondary low will be tested at $98.96. If the price breaks out of the $114.29-$100.80 secondary trading range, the corresponding pullback range of $107.55-$109.14 will become the subsequent upside target area. The market is currently testing the intermediate support zone of $102.75-$100.27, slightly above the 50-day moving average at $98.65. The long-term trading range is $70.96-$114.29, with a retracement range of $92.63-$87.51, near the 200-day moving average at $83.65. The key low of $92.64 and the long-term 50% retracement level of $92.63 form strong, dense support, with the next key low of $91.21 falling within the long-term retracement range. Key points to watch for December WTI crude oil futures : The primary trend is upward, the secondary trend is downward, and trend indicator signals are contradictory. Therefore, the 50-day moving average at $91.94 is considered the primary trend support. This moving average has dominated the current upward trend, and buyers are currently defending the short-term retracement range of $95.50-$93.25. If the price stabilizes above the 50% retracement level of the upper limit of the range at $95.50, it will accumulate momentum to challenge the target range of $99.29-$100.64, which will be a crucial test for the bulls. If buying returns, the price is expected to break through $100.64 and further rise to $104.99; if selling emerges, a secondary high will form, and the market will come under pressure again, with the 50-day moving average becoming the next potential downside target. Essentially, to maintain a bullish outlook, WTI crude oil must hold the 50-day moving average and break above $100.64. January Brent crude oil futures , consistent with WTI futures, show divergent trend indicators, with the primary trend upward and the secondary trend downward. The market's focus is on the 50-day moving average, which serves as both a trend signal and support. The early morning price action suggests that the market's reaction to the $102.75-$100.27 range will determine the short-term market direction. If the price continues to hold above the 50% retracement level of $102.75, a rebound to the $107.55-$109.14 range is possible. If the 61.8% retracement level of $100.27 is breached, the price will quickly test the 50-day moving average at $98.65; if this moving average support is also broken, the selling pressure will continue, targeting the long-term retracement range of $92.63-$87.51. Although the primary trend is upward, the secondary trend has reversed, and my bullish bias has weakened. However, as long as the 50-day moving average support holds, the bullish outlook will not be abandoned. Once the selling pressure is strong enough to break below $92.64, the primary trend will turn downward; if it further breaks below $91.21, the downtrend will be confirmed, and traders may sell on rallies. For the long-term uptrend to be sustained, the 50-day moving average support must withstand the test.
Over the past two weeks, crude oil prices climbed to multi-month highs, with the market widely anticipating that Trump would escalate sanctions against Iran following the midterm elections. However, with negotiations progressing and rumors of significant concessions from Iran, traders anticipate a more substantial agreement. As a result, bullish traders began taking profits, and some of the war premium accumulated in the market diminished. December WTI crude oil futures daily technical analysis. From the daily chart, the main market trend is upward. If the price breaks below $86.00, the main trend will turn downward; if it breaks above $104.99, it indicates a resumption of the upward trend. The retracement range formed by this fluctuation range is $95.50-$93.25. The secondary trend has turned downward. On Tuesday, sellers broke through the swing low of $95.25, turning the secondary trend bearish, and market momentum may shift to the downside. If a secondary fluctuation range of $104.99-$93.59 is formed, the corresponding retracement range of $99.29-$100.64 will become the next upside target. The intermediate fluctuation range is $77.18-$104.99, and the retracement range of $91.09-$87.80 is another potential downside target, followed by the long-term retracement range of $88.00-$83.98. The two retracement ranges overlap, forming a dense support zone at $88.00-$87.80. The current price action remains above the 50-day moving average; this level of $91.94 also provides support today, falling between the short-term 61.8% Fibonacci retracement level of $93.25 and the intermediate 50% retracement level of $91.09. A break above $104.99 could see the price test the historical highs of $106.75 and $107.77. January Brent crude oil futures daily technical analysis. January Brent crude futures fell in early trading on Wednesday, but showed signs of attempting to establish new support. The daily chart shows the primary trend remains upward, but the secondary trend has turned bearish, with market momentum leaning towards declines. A break above $114.29 would confirm the continuation of the uptrend; a break below $92.64 would reverse the primary trend; and a break below $91.21 would further confirm the downtrend. The sell-off that began at $114.29 broke through the secondary lows of $109.02 and $101.12, pushing the secondary trend bearish. If prices continue to fall below $100.80, the next secondary low will be tested at $98.96. If the price breaks out of the $114.29-$100.80 secondary trading range, the corresponding pullback range of $107.55-$109.14 will become the subsequent upside target area. The market is currently testing the intermediate support zone of $102.75-$100.27, slightly above the 50-day moving average at $98.65. The long-term trading range is $70.96-$114.29, with a retracement range of $92.63-$87.51, near the 200-day moving average at $83.65. The key low of $92.64 and the long-term 50% retracement level of $92.63 form strong, dense support, with the next key low of $91.21 falling within the long-term retracement range. Key points to watch for December WTI crude oil futures : The primary trend is upward, the secondary trend is downward, and trend indicator signals are contradictory. Therefore, the 50-day moving average at $91.94 is considered the primary trend support. This moving average has dominated the current upward trend, and buyers are currently defending the short-term retracement range of $95.50-$93.25. If the price stabilizes above the 50% retracement level of the upper limit of the range at $95.50, it will accumulate momentum to challenge the target range of $99.29-$100.64, which will be a crucial test for the bulls. If buying returns, the price is expected to break through $100.64 and further rise to $104.99; if selling emerges, a secondary high will form, and the market will come under pressure again, with the 50-day moving average becoming the next potential downside target. Essentially, to maintain a bullish outlook, WTI crude oil must hold the 50-day moving average and break above $100.64. January Brent crude oil futures , consistent with WTI futures, show divergent trend indicators, with the primary trend upward and the secondary trend downward. The market's focus is on the 50-day moving average, which serves as both a trend signal and support. The early morning price action suggests that the market's reaction to the $102.75-$100.27 range will determine the short-term market direction. If the price continues to hold above the 50% retracement level of $102.75, a rebound to the $107.55-$109.14 range is possible. If the 61.8% retracement level of $100.27 is breached, the price will quickly test the 50-day moving average at $98.65; if this moving average support is also broken, the selling pressure will continue, targeting the long-term retracement range of $92.63-$87.51. Although the primary trend is upward, the secondary trend has reversed, and my bullish bias has weakened. However, as long as the 50-day moving average support holds, the bullish outlook will not be abandoned. Once the selling pressure is strong enough to break below $92.64, the primary trend will turn downward; if it further breaks below $91.21, the downtrend will be confirmed, and traders may sell on rallies. For the long-term uptrend to be sustained, the 50-day moving average support must withstand the test.
- Risk Warning and Disclaimer
- The market involves risk, and trading may not be suitable for all investors. This article is for reference only and does not constitute personal investment advice, nor does it take into account certain users’ specific investment objectives, financial situation, or other needs. Any investment decisions made based on this information are at your own risk.