













Rising expectations of a Fed rate hike have not altered the upward trend in gold prices, which may rise further in the short term.
2026-11-09 10:40:27
Gold prices rebounded from lows in Asian trading on Monday, trading around $4,130 and recovering some of the previous losses. This recovery was mainly driven by rising expectations of an end to the conflict – after gaining majority in both the House and Senate, Democrats are strongly opposing President Donald Trump's proposed $1.5 trillion defense budget and appear determined to block its passage. Sources indicate that Democrats prefer to approve only about $1 trillion in defense spending because they do not want to be seen as continuing to fund the conflict against Iran.  However, the upside potential for gold prices was significantly limited. The US October non-farm payrolls report released last Friday showed an increase of 165,000 jobs, far exceeding market expectations of 65,000 and significantly higher than September's 60,000; the unemployment rate fell to 4.1% , down from 4.2% previously. The stronger-than-expected employment data reinforced expectations that the Federal Reserve would maintain high interest rates for a longer period, and higher interest rates increase the opportunity cost of holding gold, a non-interest-bearing asset. According to the CME Group's FedWatch tool, traders are currently pricing in a 79.6% probability of a Fed rate hike in December, a significant increase from 72.8% before the employment report. On the trading floor, gold prices initially gapped down due to the strong employment report, but subsequently attempted to recover. Independent metals traders stated that this was a "litmus test" of this week's upward momentum. Analysts at OCBC Bank pointed out that gold prices rose to a two-week high above $4,140 overnight, before giving back some gains due to a rebound in oil prices and a stabilizing dollar, but weaker US Treasury yields continued to provide support. The bank also cautioned that the deepening sell-off in the artificial intelligence and semiconductor sectors warrants short-term attention—if weakness in risk assets triggers broader deleveraging, the market may sell off gold, and gold prices will likely be affected. However, OCBC also emphasized that the relative resilience shown by gold prices during the sharp sell-off in risk assets is "encouraging": after the recent correction and a decline in speculative positions, gold may be gradually regaining some of its safe-haven attributes, potentially providing shelter from turmoil in other parts of the financial markets, but whether it can remain strong as risk assets continue to weaken remains a significant test. In the short term, market attention shifts to the US CPI data to be released next Tuesday, while oil prices remain a key driver of inflation and interest rate expectations. Meanwhile, the outcome of the defense budget negotiations and the pace of realization of expectations for the end of the conflict will continue to influence the flow of safe-haven funds. From a technical perspective, gold prices on the daily chart are still in a recovery phase after a sharp drop , and have not yet broken through the resistance level of the trading range. The current price of $4130 is slightly above the middle of the range, with the $4180-$4200 range acting as a key resistance zone – $4200 is precisely where the 100-day moving average is located, and the upper Bollinger Band at approximately $4225 forms a second barrier above it. Only a strong break and hold above $4180-$4200 could trigger a bullish acceleration and alleviate the current bearish bias. In terms of indicators, the price is holding above the 20-day Bollinger Band middle line, indicating that underlying demand remains, but the Relative Strength Index (RSI) is around 50.30, in neutral territory, suggesting that the latest rebound lacks the decisive momentum to challenge the upper resistance structure. On the downside, the area around $4050 is a key support level ; if this level holds, the rebound structure will continue. Above that, $4095 is the initial support level, and the Bollinger Middle Band at $4065 forms the lower edge of the short-term range. If $4050 is breached, a deeper decline will expose the lower Bollinger Band area around $3900, at which point sellers may become more cautious. On the 4-hour chart, the short-term rebound structure has not yet been broken, but momentum is showing signs of overbought conditions : the price is repeatedly struggling around $4130, and the resistance level of the $4180-$4200 range has not yet been effectively tested, making chasing the price higher before a breakout less cost-effective. In terms of scenarios, if the 4-hour chart shows a strong breakout above $4200, the daily range breakout will be confirmed, and a faster bullish move is expected. If the rebound repeatedly encounters resistance in the $4180-$4200 range and falls back, the price will retrace to the short-term support zone of $4095-$4065, and then test the key defense level of $4050.
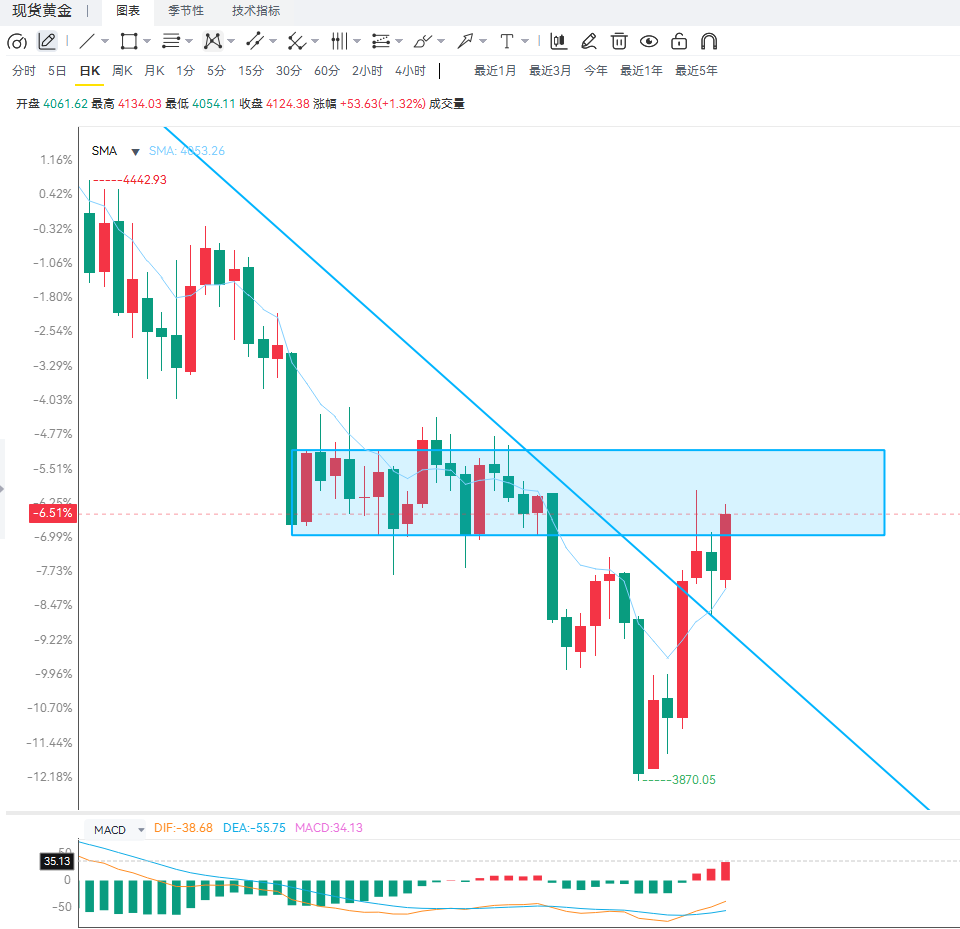 Editor's Summary: Gold is currently caught in a tug-of-war between bulls and bears, driven by both rising expectations of an end to the US-Iran conflict and renewed safe-haven buying, and strong employment data with a 79.6% probability of a rate hike. $4130 is merely the central point of the trading range; the direction remains to be seen, awaiting answers at $4180-$4200 and $4050. In the medium term, if expectations of Democratic cuts to defense spending and tightened funding continue to build, coupled with safe-haven demand fueled by volatility in risk assets, gold prices could challenge the upper limit of the trading range and open up further upside potential. However, if employment and inflation data remain strong and a December rate hike materializes, rising real interest rates will suppress gold prices. A deleveraging-driven decline in risk assets could also trigger a liquidity-driven sell-off in gold. Risks and opportunities coexist: caution is advised before a breakout above $4180-$4200; if $4050 holds, any pullback is considered a normal retracement within the bullish structure. The market is expected to fluctuate within the 4050-4200 range. Key factors to watch include the CPI, oil price trends, and the progress of the defense budget negotiation next Tuesday.
However, the upside potential for gold prices was significantly limited. The US October non-farm payrolls report released last Friday showed an increase of 165,000 jobs, far exceeding market expectations of 65,000 and significantly higher than September's 60,000; the unemployment rate fell to 4.1% , down from 4.2% previously. The stronger-than-expected employment data reinforced expectations that the Federal Reserve would maintain high interest rates for a longer period, and higher interest rates increase the opportunity cost of holding gold, a non-interest-bearing asset. According to the CME Group's FedWatch tool, traders are currently pricing in a 79.6% probability of a Fed rate hike in December, a significant increase from 72.8% before the employment report. On the trading floor, gold prices initially gapped down due to the strong employment report, but subsequently attempted to recover. Independent metals traders stated that this was a "litmus test" of this week's upward momentum. Analysts at OCBC Bank pointed out that gold prices rose to a two-week high above $4,140 overnight, before giving back some gains due to a rebound in oil prices and a stabilizing dollar, but weaker US Treasury yields continued to provide support. The bank also cautioned that the deepening sell-off in the artificial intelligence and semiconductor sectors warrants short-term attention—if weakness in risk assets triggers broader deleveraging, the market may sell off gold, and gold prices will likely be affected. However, OCBC also emphasized that the relative resilience shown by gold prices during the sharp sell-off in risk assets is "encouraging": after the recent correction and a decline in speculative positions, gold may be gradually regaining some of its safe-haven attributes, potentially providing shelter from turmoil in other parts of the financial markets, but whether it can remain strong as risk assets continue to weaken remains a significant test. In the short term, market attention shifts to the US CPI data to be released next Tuesday, while oil prices remain a key driver of inflation and interest rate expectations. Meanwhile, the outcome of the defense budget negotiations and the pace of realization of expectations for the end of the conflict will continue to influence the flow of safe-haven funds. From a technical perspective, gold prices on the daily chart are still in a recovery phase after a sharp drop , and have not yet broken through the resistance level of the trading range. The current price of $4130 is slightly above the middle of the range, with the $4180-$4200 range acting as a key resistance zone – $4200 is precisely where the 100-day moving average is located, and the upper Bollinger Band at approximately $4225 forms a second barrier above it. Only a strong break and hold above $4180-$4200 could trigger a bullish acceleration and alleviate the current bearish bias. In terms of indicators, the price is holding above the 20-day Bollinger Band middle line, indicating that underlying demand remains, but the Relative Strength Index (RSI) is around 50.30, in neutral territory, suggesting that the latest rebound lacks the decisive momentum to challenge the upper resistance structure. On the downside, the area around $4050 is a key support level ; if this level holds, the rebound structure will continue. Above that, $4095 is the initial support level, and the Bollinger Middle Band at $4065 forms the lower edge of the short-term range. If $4050 is breached, a deeper decline will expose the lower Bollinger Band area around $3900, at which point sellers may become more cautious. On the 4-hour chart, the short-term rebound structure has not yet been broken, but momentum is showing signs of overbought conditions : the price is repeatedly struggling around $4130, and the resistance level of the $4180-$4200 range has not yet been effectively tested, making chasing the price higher before a breakout less cost-effective. In terms of scenarios, if the 4-hour chart shows a strong breakout above $4200, the daily range breakout will be confirmed, and a faster bullish move is expected. If the rebound repeatedly encounters resistance in the $4180-$4200 range and falls back, the price will retrace to the short-term support zone of $4095-$4065, and then test the key defense level of $4050. Editor's Summary: Gold is currently caught in a tug-of-war between bulls and bears, driven by both rising expectations of an end to the US-Iran conflict and renewed safe-haven buying, and strong employment data with a 79.6% probability of a rate hike. $4130 is merely the central point of the trading range; the direction remains to be seen, awaiting answers at $4180-$4200 and $4050. In the medium term, if expectations of Democratic cuts to defense spending and tightened funding continue to build, coupled with safe-haven demand fueled by volatility in risk assets, gold prices could challenge the upper limit of the trading range and open up further upside potential. However, if employment and inflation data remain strong and a December rate hike materializes, rising real interest rates will suppress gold prices. A deleveraging-driven decline in risk assets could also trigger a liquidity-driven sell-off in gold. Risks and opportunities coexist: caution is advised before a breakout above $4180-$4200; if $4050 holds, any pullback is considered a normal retracement within the bullish structure. The market is expected to fluctuate within the 4050-4200 range. Key factors to watch include the CPI, oil price trends, and the progress of the defense budget negotiation next Tuesday.
- Risk Warning and Disclaimer
- The market involves risk, and trading may not be suitable for all investors. This article is for reference only and does not constitute personal investment advice, nor does it take into account certain users’ specific investment objectives, financial situation, or other needs. Any investment decisions made based on this information are at your own risk.