













Rising real yields and a stronger dollar weighed on gold prices, while Trump's actions jeopardized the prospects for an Iran deal.
2026-11-13 17:38:28
Gold continues to face downward pressure from multiple factors, including hawkish market pricing revaluation, rising real yields, and a strong dollar. However, if the conflict between the US and Iran continues to escalate, the market may eventually fall into a stagflationary pattern, which, in the long run, would open up upside potential for gold. Conversely, if tensions between the US and Iran ease, the market will repric expectations of further easing, providing short-term support for gold prices. While both scenarios offer potential benefits for gold, it currently faces multiple strong headwinds. Fundamental news alone is insufficient to reverse the trend; a clear reversal signal in price momentum is needed to confirm a substantial change in the trend.  Following Trump's public statement on the Truth social media platform that the US does not need a deal with Iran and his instruction to Vice President Vance to shift his focus to domestic affairs, gold prices fell further yesterday. This statement shattered previous market optimism about the resumption of US-Iran negotiations and the achievement of a new reconciliation agreement, rapidly rewriting the pricing logic of geopolitical risks. After the statement, the US dollar index and US Treasury yields surged simultaneously, and oil prices continued their upward trend. Market concerns about inflation intensified significantly, and traders further increased their bets that the Federal Reserve would continue to raise interest rates. Rising energy prices will directly impact the cost of consumer goods across the US, further solidifying inflation stickiness and forcing monetary policy to remain tight. Historically, a high-interest-rate environment has directly suppressed gold, a non-interest-bearing asset. Driven by the repricing of hawkish expectations, rising real yields, and a continuously strengthening US dollar, the downward pressure on the gold market is currently very pronounced. Funds continue to flow out of safe-haven gold positions and into the US dollar and US Treasury assets seeking returns, further amplifying the pullback in gold prices. Looking ahead, considering that the duration of the US-Iran tensions may exceed previous market expectations, concerns about economic growth will accumulate, and the tightening monetary policy will gradually transmit to the real economy. Signs of pressure on corporate profits and weakening consumer confidence will slowly emerge, and interest rate hikes are expected to put significant downward pressure on the stock market and long-term US Treasury yields. In the current macroeconomic context, if Trump chooses to further escalate the confrontation with Iran, inflation expectations will rise, while the economic growth outlook will weaken simultaneously, leading to a stagflationary market environment. This dilemma—high prices on one hand and a continued slowdown in economic momentum on the other—will weaken the attractiveness of risk assets, and gold's value as an inflation hedge will be re-emphasized, ultimately benefiting gold prices. Conversely, if the US-Iran situation eases, inflation concerns will subside, and the market will begin a dovish repricing. Traders will anticipate the possibility of the Federal Reserve pausing interest rate hikes or even turning to rate cuts, which will also boost gold in the short term. The various headwinds and resistances currently facing gold cannot be ignored. Therefore, the above fundamental analysis must be combined with technical signals. Fundamentals provide the potential direction, while technical indicators confirm entry points. Only by mutually verifying each other can the reliability of trading decisions be improved, thereby confirming whether market momentum has changed. Gold Technical Analysis – Daily Chart
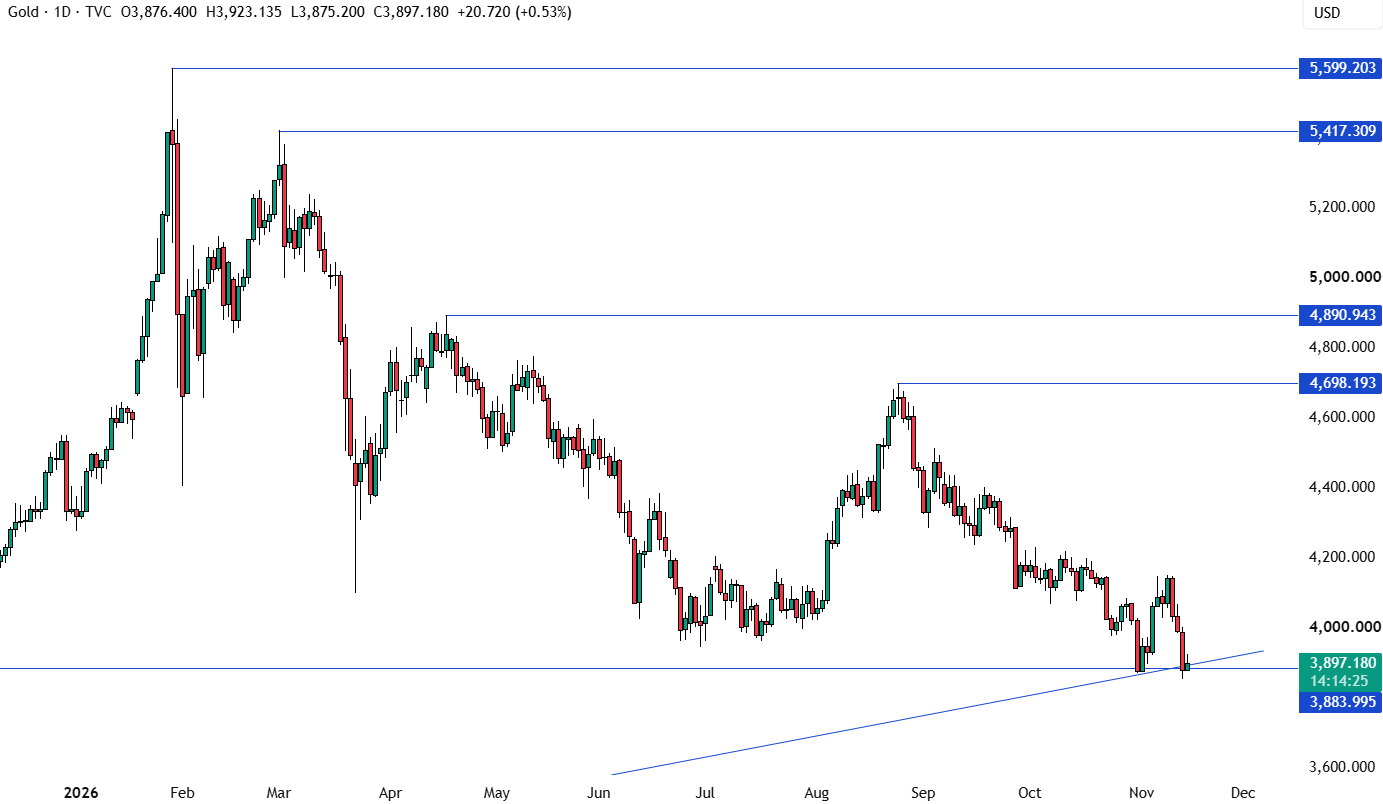 The daily chart shows that gold CFDs continued their selling pressure, testing the key support level of 3885. This level coincides with a significant upward trendline, creating a support confluence effect. This area was a crucial battleground between bulls and bears in the past, accumulating a large number of historical order books and serving as a key defensive barrier for the bulls. It is expected that bullish funds will enter heavily near this support level, placing stop-loss orders below recent lows and targeting 4700. Conversely, bearish traders will wait for a decisive break below this support area before adding to their short positions, with the next major downside target at 3500. Gold Technical Analysis – 4-Hour Chart
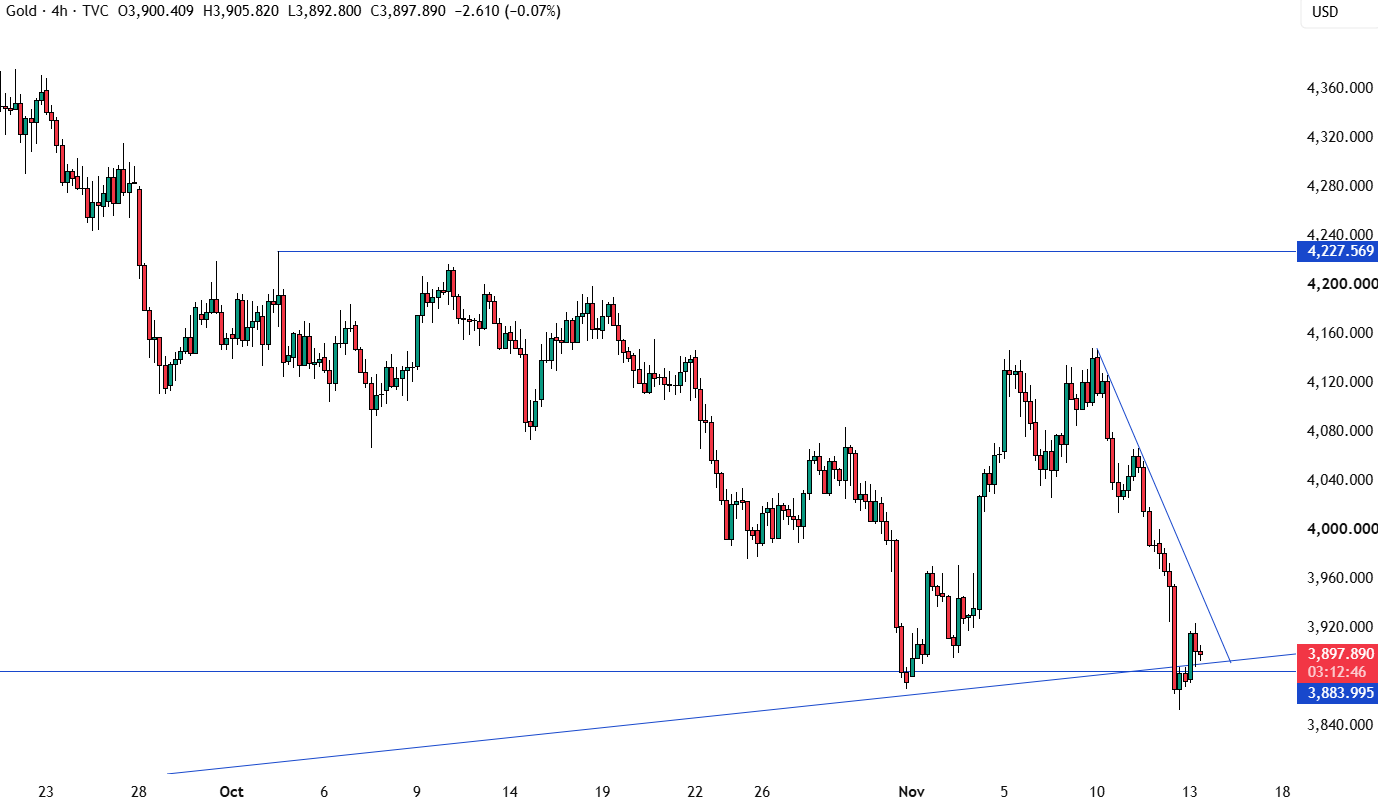 On the 4-hour chart, a downward trend line defines the current bearish price momentum. If gold prices rebound, short traders will likely place short orders based on this trend line, setting stop-loss orders above the trend line, continuing to bet on gold prices to reach new lows. Long traders, on the other hand, need to wait for the price to break above this trend line before adding to their long positions, with an initial target of 4200 and a subsequent ultimate target of 4700. The 4-hour timeframe is well-suited for capturing medium-term swings, and the hold or breach of this trend line will determine the main theme of gold's movement in the coming days. Gold Technical Analysis – 1-Hour Chart
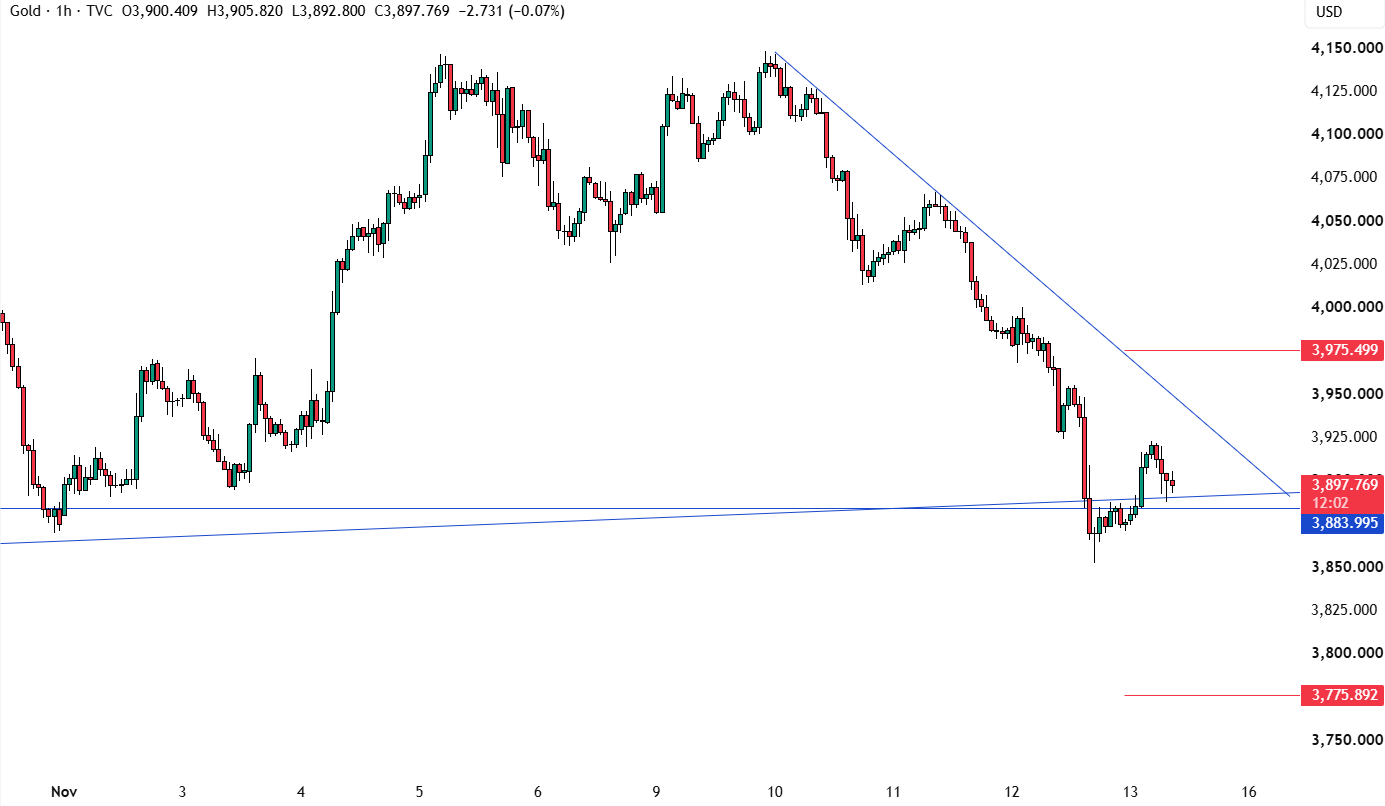 The 1-hour chart didn't reveal many new signals: short sellers could find a better risk-reward opportunity near the downtrend line; while longs tended to enter in batches within the current price range, betting on a rebound to 4700. The red line in the chart marks today's average daily trading range (ADR) for gold. The 1-hour chart is more suitable for short-term trading; the price will likely oscillate within the ADR range, and a new one-sided trend will only begin once it breaks out of the range. Upcoming Market Catalysts The last important data of the week is the US Producer Price Index (PPI), which will conclude the week's trading. The PPI reflects the inflation level of upstream industrial products and directly affects market judgments on subsequent CPI and the Fed's interest rate path. The strength or weakness of the data will cause significant fluctuations in the US dollar and US Treasury yields, subsequently driving short-term price movements in gold.
Following Trump's public statement on the Truth social media platform that the US does not need a deal with Iran and his instruction to Vice President Vance to shift his focus to domestic affairs, gold prices fell further yesterday. This statement shattered previous market optimism about the resumption of US-Iran negotiations and the achievement of a new reconciliation agreement, rapidly rewriting the pricing logic of geopolitical risks. After the statement, the US dollar index and US Treasury yields surged simultaneously, and oil prices continued their upward trend. Market concerns about inflation intensified significantly, and traders further increased their bets that the Federal Reserve would continue to raise interest rates. Rising energy prices will directly impact the cost of consumer goods across the US, further solidifying inflation stickiness and forcing monetary policy to remain tight. Historically, a high-interest-rate environment has directly suppressed gold, a non-interest-bearing asset. Driven by the repricing of hawkish expectations, rising real yields, and a continuously strengthening US dollar, the downward pressure on the gold market is currently very pronounced. Funds continue to flow out of safe-haven gold positions and into the US dollar and US Treasury assets seeking returns, further amplifying the pullback in gold prices. Looking ahead, considering that the duration of the US-Iran tensions may exceed previous market expectations, concerns about economic growth will accumulate, and the tightening monetary policy will gradually transmit to the real economy. Signs of pressure on corporate profits and weakening consumer confidence will slowly emerge, and interest rate hikes are expected to put significant downward pressure on the stock market and long-term US Treasury yields. In the current macroeconomic context, if Trump chooses to further escalate the confrontation with Iran, inflation expectations will rise, while the economic growth outlook will weaken simultaneously, leading to a stagflationary market environment. This dilemma—high prices on one hand and a continued slowdown in economic momentum on the other—will weaken the attractiveness of risk assets, and gold's value as an inflation hedge will be re-emphasized, ultimately benefiting gold prices. Conversely, if the US-Iran situation eases, inflation concerns will subside, and the market will begin a dovish repricing. Traders will anticipate the possibility of the Federal Reserve pausing interest rate hikes or even turning to rate cuts, which will also boost gold in the short term. The various headwinds and resistances currently facing gold cannot be ignored. Therefore, the above fundamental analysis must be combined with technical signals. Fundamentals provide the potential direction, while technical indicators confirm entry points. Only by mutually verifying each other can the reliability of trading decisions be improved, thereby confirming whether market momentum has changed. Gold Technical Analysis – Daily Chart The daily chart shows that gold CFDs continued their selling pressure, testing the key support level of 3885. This level coincides with a significant upward trendline, creating a support confluence effect. This area was a crucial battleground between bulls and bears in the past, accumulating a large number of historical order books and serving as a key defensive barrier for the bulls. It is expected that bullish funds will enter heavily near this support level, placing stop-loss orders below recent lows and targeting 4700. Conversely, bearish traders will wait for a decisive break below this support area before adding to their short positions, with the next major downside target at 3500. Gold Technical Analysis – 4-Hour Chart On the 4-hour chart, a downward trend line defines the current bearish price momentum. If gold prices rebound, short traders will likely place short orders based on this trend line, setting stop-loss orders above the trend line, continuing to bet on gold prices to reach new lows. Long traders, on the other hand, need to wait for the price to break above this trend line before adding to their long positions, with an initial target of 4200 and a subsequent ultimate target of 4700. The 4-hour timeframe is well-suited for capturing medium-term swings, and the hold or breach of this trend line will determine the main theme of gold's movement in the coming days. Gold Technical Analysis – 1-Hour Chart The 1-hour chart didn't reveal many new signals: short sellers could find a better risk-reward opportunity near the downtrend line; while longs tended to enter in batches within the current price range, betting on a rebound to 4700. The red line in the chart marks today's average daily trading range (ADR) for gold. The 1-hour chart is more suitable for short-term trading; the price will likely oscillate within the ADR range, and a new one-sided trend will only begin once it breaks out of the range. Upcoming Market Catalysts The last important data of the week is the US Producer Price Index (PPI), which will conclude the week's trading. The PPI reflects the inflation level of upstream industrial products and directly affects market judgments on subsequent CPI and the Fed's interest rate path. The strength or weakness of the data will cause significant fluctuations in the US dollar and US Treasury yields, subsequently driving short-term price movements in gold.
- Risk Warning and Disclaimer
- The market involves risk, and trading may not be suitable for all investors. This article is for reference only and does not constitute personal investment advice, nor does it take into account certain users’ specific investment objectives, financial situation, or other needs. Any investment decisions made based on this information are at your own risk.