Crude Oil Trading Alert: Geopolitical tensions support risk premium; US crude oil continues its oversold rebound.
2026-11-16 09:18:31
On Monday during Asian trading hours, US crude oil prices retreated slightly, trading around $88.30. News-wise, Iran hinted at the possibility of diplomatic mediation, while the US stated it might not launch a new round of attacks. The market continued to price in a de-escalation of the Middle East conflict, and the geopolitical risk premium that had previously driven up oil prices continued to decline, creating medium-term downward pressure. However, regional conflicts have not subsided. On Sunday, Iran attacked a US military helicopter base in Bahrain, and several ships were hit by mines, and oil tankers were attacked. The safety risks in the Strait of Hormuz remain. Such sudden news could trigger impulsive buying at any time, limiting the potential for further declines in oil prices.  On the supply and demand front, IEA data is the core logic behind the bearish outlook. The report shows that since the outbreak of this round of conflict, global crude oil supply and demand have shifted to oversupply for the first time. With the gradual recovery of shipping in the Strait of Hormuz, the crude oil surplus this quarter is expected to reach 2 million barrels per day, completely reversing the previous market panic about supply shortages and weakening the fundamental support for crude oil bulls from the bottom up. US domestic energy legislation is also disrupting long-term expectations. The Senate has launched debates on the "Bipartisan American Affordability and Jobs Act," which aims to simplify the approval process for energy infrastructure projects. However, after the midterm elections, the Democrats control both the House and Senate, and significant divisions have emerged within the camp: some senators advocate shelving the bill until they take power next year to introduce a version with stronger constraints on fossil fuels; the other side hopes to seize the current window of bipartisan consensus, and Trump has also expressed his willingness to sign it. This policy uncertainty has caused market expectations for medium- to long-term US domestic crude oil supply to fluctuate, further amplifying the volatility of oil prices. Overall, the current oil market is in a volatile environment of "bearish factors providing a floor, and geopolitical news causing disturbances." The fundamental outlook is generally accommodative, but the risk of black swan events remains high. The rebound lacks sustained fundamental drivers and is more of a technical correction after the previous rapid decline. Once the rebound reaches the resistance zone, profit-taking is expected, increasing the probability of a second pullback. It is necessary to continuously monitor the status of navigation in the Taiwan Strait, US-Iran diplomatic statements, and the progress of the US energy infrastructure bill vote, as news could easily disrupt the current consolidation pattern. Technically, WTI is currently trading around 88.30, exhibiting a typical oversold rebound structure on the daily chart. After rebounding from the previous low, the price has approached the dense resistance zone above but has not yet formed a valid breakout. The daily MACD indicator remains in a bearish structure; the fast and slow lines have not formed a bullish golden cross, and although the green momentum bars continue to shrink, they have not turned red to confirm a bullish trend. This indicates that this rebound is merely a correction after the exhaustion of bearish momentum, not a trend reversal signal. Bullish momentum is insufficient, and profit-taking is likely near the resistance level, raising the possibility of a second pullback to test support. From the perspective of moving average structure, the short-term rebound has touched the resistance of the medium- and long-term descending moving averages, and the moving average system has not yet turned upward, indicating that the rebound is facing significant pressure. The core resistance on the daily chart is at $89.50, a high-volume trading area during the previous decline, coupled with the confluence of moving average resistance. Only if the daily closing price holds above this level can the rebound be confirmed and further upward movement opened up; conversely, a pullback will retest the lower support. The key support below is around $86.00, which is the low point of this oversold condition and the starting platform of this rebound, representing a crucial support level for the bulls. If the $86.00 support holds, the daily chart will maintain a wide-range oscillation pattern; once this support is effectively broken, the current rebound will be over, and the bearish trend will resume. On the short-term 4-hour chart, the RSI has rebounded from the oversold zone to the neutral zone, not entering overbought territory, indicating a clear oscillation pattern; the Bollinger Bands are gradually narrowing, and volatility is converging, suggesting that a directional decision window is approaching. Aggressive bullishness is not advisable; it is best to wait for confirmation after a pullback to support.
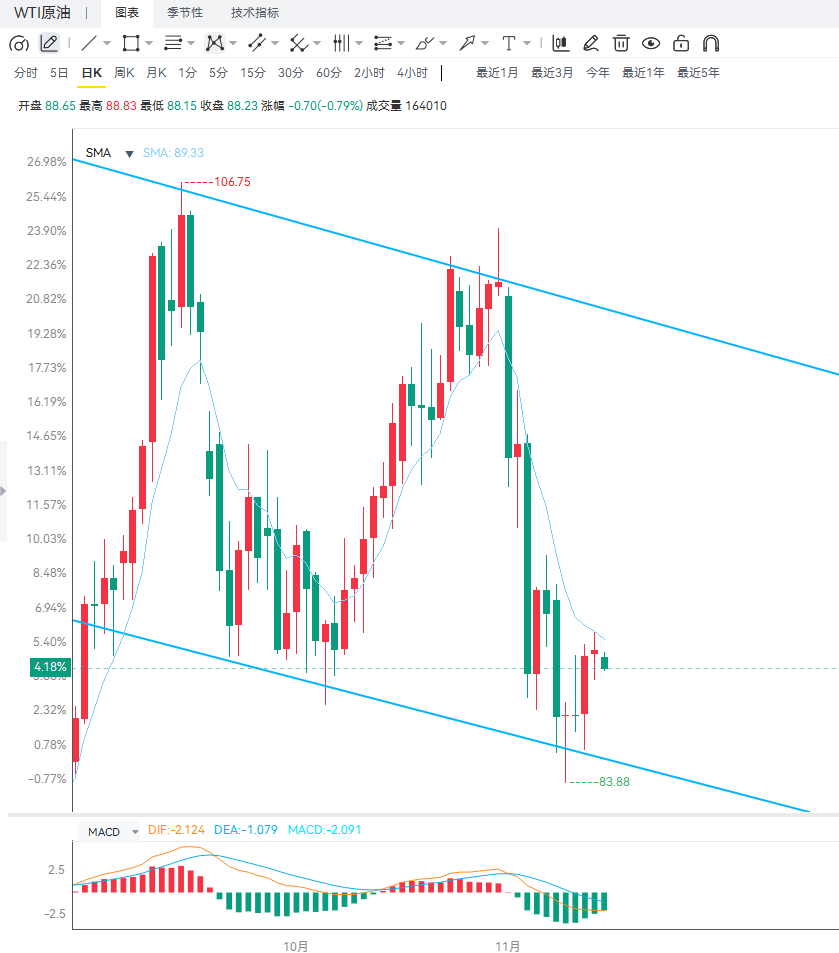 Editor's Summary: The current crude oil pricing logic is in a phase of balancing between easing fundamentals and geopolitical risks. The market movement is characterized by a technical correction and rebound, rather than a trend reversal. Technically, the MACD's failure to form a golden cross is a significant risk signal, indicating that the bulls have not gained the upper hand. Until the 89.50 resistance level is firmly established, consolidation and a second pullback are more likely. It is necessary to distinguish between structural signals and news-driven impulses. Rapid rallies driven by geopolitical news should be treated with caution until a key resistance level is broken.
On the supply and demand front, IEA data is the core logic behind the bearish outlook. The report shows that since the outbreak of this round of conflict, global crude oil supply and demand have shifted to oversupply for the first time. With the gradual recovery of shipping in the Strait of Hormuz, the crude oil surplus this quarter is expected to reach 2 million barrels per day, completely reversing the previous market panic about supply shortages and weakening the fundamental support for crude oil bulls from the bottom up. US domestic energy legislation is also disrupting long-term expectations. The Senate has launched debates on the "Bipartisan American Affordability and Jobs Act," which aims to simplify the approval process for energy infrastructure projects. However, after the midterm elections, the Democrats control both the House and Senate, and significant divisions have emerged within the camp: some senators advocate shelving the bill until they take power next year to introduce a version with stronger constraints on fossil fuels; the other side hopes to seize the current window of bipartisan consensus, and Trump has also expressed his willingness to sign it. This policy uncertainty has caused market expectations for medium- to long-term US domestic crude oil supply to fluctuate, further amplifying the volatility of oil prices. Overall, the current oil market is in a volatile environment of "bearish factors providing a floor, and geopolitical news causing disturbances." The fundamental outlook is generally accommodative, but the risk of black swan events remains high. The rebound lacks sustained fundamental drivers and is more of a technical correction after the previous rapid decline. Once the rebound reaches the resistance zone, profit-taking is expected, increasing the probability of a second pullback. It is necessary to continuously monitor the status of navigation in the Taiwan Strait, US-Iran diplomatic statements, and the progress of the US energy infrastructure bill vote, as news could easily disrupt the current consolidation pattern. Technically, WTI is currently trading around 88.30, exhibiting a typical oversold rebound structure on the daily chart. After rebounding from the previous low, the price has approached the dense resistance zone above but has not yet formed a valid breakout. The daily MACD indicator remains in a bearish structure; the fast and slow lines have not formed a bullish golden cross, and although the green momentum bars continue to shrink, they have not turned red to confirm a bullish trend. This indicates that this rebound is merely a correction after the exhaustion of bearish momentum, not a trend reversal signal. Bullish momentum is insufficient, and profit-taking is likely near the resistance level, raising the possibility of a second pullback to test support. From the perspective of moving average structure, the short-term rebound has touched the resistance of the medium- and long-term descending moving averages, and the moving average system has not yet turned upward, indicating that the rebound is facing significant pressure. The core resistance on the daily chart is at $89.50, a high-volume trading area during the previous decline, coupled with the confluence of moving average resistance. Only if the daily closing price holds above this level can the rebound be confirmed and further upward movement opened up; conversely, a pullback will retest the lower support. The key support below is around $86.00, which is the low point of this oversold condition and the starting platform of this rebound, representing a crucial support level for the bulls. If the $86.00 support holds, the daily chart will maintain a wide-range oscillation pattern; once this support is effectively broken, the current rebound will be over, and the bearish trend will resume. On the short-term 4-hour chart, the RSI has rebounded from the oversold zone to the neutral zone, not entering overbought territory, indicating a clear oscillation pattern; the Bollinger Bands are gradually narrowing, and volatility is converging, suggesting that a directional decision window is approaching. Aggressive bullishness is not advisable; it is best to wait for confirmation after a pullback to support. Editor's Summary: The current crude oil pricing logic is in a phase of balancing between easing fundamentals and geopolitical risks. The market movement is characterized by a technical correction and rebound, rather than a trend reversal. Technically, the MACD's failure to form a golden cross is a significant risk signal, indicating that the bulls have not gained the upper hand. Until the 89.50 resistance level is firmly established, consolidation and a second pullback are more likely. It is necessary to distinguish between structural signals and news-driven impulses. Rapid rallies driven by geopolitical news should be treated with caution until a key resistance level is broken.
- Risk Warning and Disclaimer
- The market involves risk, and trading may not be suitable for all investors. This article is for reference only and does not constitute personal investment advice, nor does it take into account certain users’ specific investment objectives, financial situation, or other needs. Any investment decisions made based on this information are at your own risk.