The US dollar rose for the fifth consecutive day, nearing its previous high, awaiting a stress test.
2026-11-16 11:16:30
The strengthening US dollar is the main driver of the continued rise in the USD/CAD exchange rate. The market widely expects the Federal Reserve to raise interest rates by 25 basis points at its December meeting, increasing the current interest rate range from 3.75% to 4.00%, and anticipates another rate hike in January. The CME FedWatch Tool shows a 93.5% probability of a 25bp rate hike in December. Kansas City Fed President Schmid reiterated over the weekend that the Fed has the tools and the responsibility to address high price pressures, and that work remains to be done in combating inflation, further reinforcing market expectations of tightening.  The Canadian dollar is under double pressure. On the one hand, the Middle East has hinted at the possibility of a diplomatic solution to the conflict, and Trump has stated that he may not launch a new round of attacks. Market concerns about supply disruptions have eased, and international oil prices have fallen. As the currency of a resource-exporting country, the weakening oil prices directly suppress the Canadian dollar's performance. On the other hand, institutional analysts point out that Canada lacks cyclical positive support, making it difficult for the Canadian dollar to break out of its own economic cycle based on domestic economic data. Its trend is highly dependent on North American macroeconomic policies and the external commodity environment. The next two trading days will see key data releases: Tuesday will see the release of the US October retail sales report, which will reflect the resilience of US consumer spending; Wednesday will see the release of the FOMC meeting minutes, from which the market will interpret officials' collective views on the future path of interest rate hikes. If US consumer data is stronger than expected, it will further boost the US dollar, and the USD/CAD pair is expected to continue its upward trend; conversely, if the data is weak, the exchange rate will experience a correction. On the daily chart, the USD/CAD price has risen above the 9 and 50 index moving averages, indicating a clear short-term bullish pattern. The short-term EMA is running above the long-term EMA, and the price is rising in tandem, forming a typical bullish trend structure. The 14-period RSI reading is 68.23, very close to the overbought threshold, indicating that upward momentum remains strong. However, after continuous gains, the momentum has begun to weaken, and once the bullish momentum diminishes, a pullback towards the moving average support level is likely. On the downside, the first support level is the 9-period EMA at 1.4188; deeper support lies at the 50-period EMA at 1.4089. As long as the exchange rate holds above these two moving average supports, pullbacks will attract buying, and the larger-scale bullish trend will not be broken. A decisive break below these levels would signify the end of this upward phase. The first resistance level is 1.4300, the previous year's high, with strong resistance at 1.4360. The 4-hour chart shows a healthy bullish formation, but the RSI is near overbought territory, making it unsuitable to chase the price higher. Trading should wait for a pullback to the moving average support before assessing potential buying opportunities, closely monitoring the potential for price jumps driven by US retail sales and the FOMC minutes.
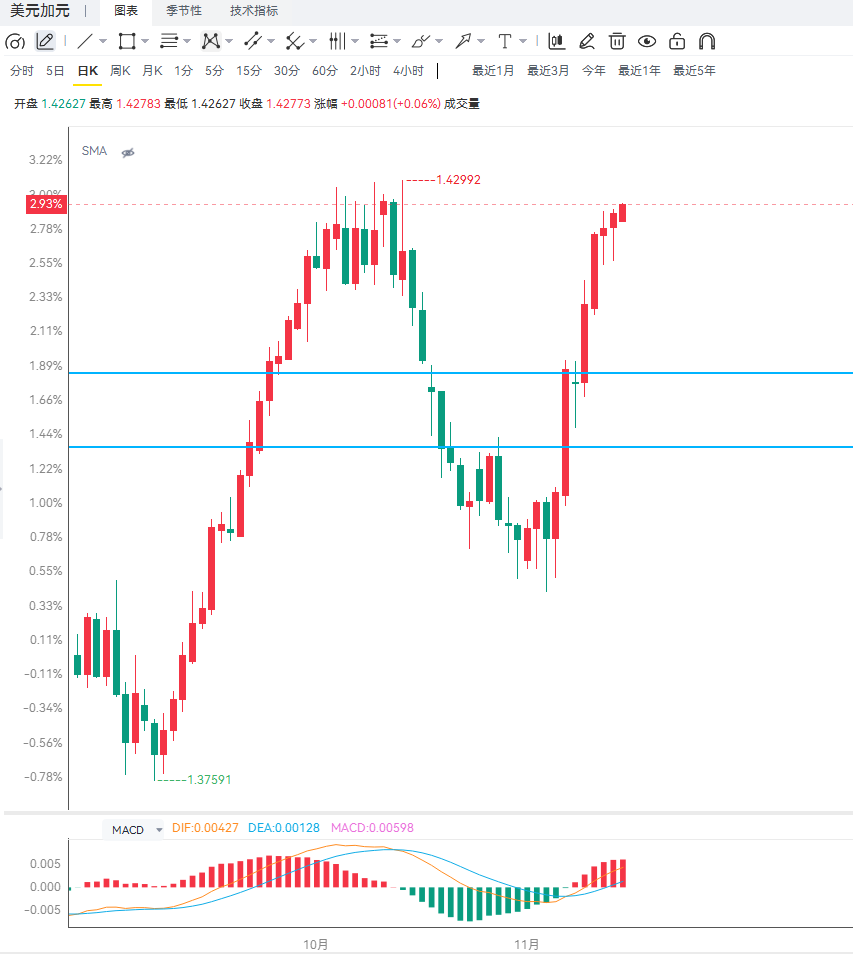 Editor's Summary: The current logic for the USD/CAD pair is that expectations of a Fed rate hike are pushing up the US dollar, while falling oil prices are weakening the Canadian dollar, and Canada lacks domestic positive factors to offset external pressure. Technically, the bullish trend is clear, but indicators are approaching overbought levels, so be wary of profit-taking leading to a pullback. 1.4300 is a significant psychological resistance level; a break above this level would open up new upside potential. If it falls back under pressure, pay close attention to the effectiveness of the support levels at 1.4188 and 1.4089.
The Canadian dollar is under double pressure. On the one hand, the Middle East has hinted at the possibility of a diplomatic solution to the conflict, and Trump has stated that he may not launch a new round of attacks. Market concerns about supply disruptions have eased, and international oil prices have fallen. As the currency of a resource-exporting country, the weakening oil prices directly suppress the Canadian dollar's performance. On the other hand, institutional analysts point out that Canada lacks cyclical positive support, making it difficult for the Canadian dollar to break out of its own economic cycle based on domestic economic data. Its trend is highly dependent on North American macroeconomic policies and the external commodity environment. The next two trading days will see key data releases: Tuesday will see the release of the US October retail sales report, which will reflect the resilience of US consumer spending; Wednesday will see the release of the FOMC meeting minutes, from which the market will interpret officials' collective views on the future path of interest rate hikes. If US consumer data is stronger than expected, it will further boost the US dollar, and the USD/CAD pair is expected to continue its upward trend; conversely, if the data is weak, the exchange rate will experience a correction. On the daily chart, the USD/CAD price has risen above the 9 and 50 index moving averages, indicating a clear short-term bullish pattern. The short-term EMA is running above the long-term EMA, and the price is rising in tandem, forming a typical bullish trend structure. The 14-period RSI reading is 68.23, very close to the overbought threshold, indicating that upward momentum remains strong. However, after continuous gains, the momentum has begun to weaken, and once the bullish momentum diminishes, a pullback towards the moving average support level is likely. On the downside, the first support level is the 9-period EMA at 1.4188; deeper support lies at the 50-period EMA at 1.4089. As long as the exchange rate holds above these two moving average supports, pullbacks will attract buying, and the larger-scale bullish trend will not be broken. A decisive break below these levels would signify the end of this upward phase. The first resistance level is 1.4300, the previous year's high, with strong resistance at 1.4360. The 4-hour chart shows a healthy bullish formation, but the RSI is near overbought territory, making it unsuitable to chase the price higher. Trading should wait for a pullback to the moving average support before assessing potential buying opportunities, closely monitoring the potential for price jumps driven by US retail sales and the FOMC minutes. Editor's Summary: The current logic for the USD/CAD pair is that expectations of a Fed rate hike are pushing up the US dollar, while falling oil prices are weakening the Canadian dollar, and Canada lacks domestic positive factors to offset external pressure. Technically, the bullish trend is clear, but indicators are approaching overbought levels, so be wary of profit-taking leading to a pullback. 1.4300 is a significant psychological resistance level; a break above this level would open up new upside potential. If it falls back under pressure, pay close attention to the effectiveness of the support levels at 1.4188 and 1.4089.
- Risk Warning and Disclaimer
- The market involves risk, and trading may not be suitable for all investors. This article is for reference only and does not constitute personal investment advice, nor does it take into account certain users’ specific investment objectives, financial situation, or other needs. Any investment decisions made based on this information are at your own risk.