Tensions in the Gulf region continue to fuel concerns about oversupply in crude oil futures.
2026-11-16 20:12:30
On Monday (November 16), oil prices were mixed in early trading, indicating that traders were already pricing in Sunday's Iranian strike on a US helicopter base in Bahrain and the confirmed attacks on oil tankers and mines in the Gulf region. However, a major reason for the failure of oil prices to rise significantly was the ongoing diplomatic communication between Tehran and Washington. Last week, there were indications that Iran signaled that there was still room for reconciliation in the conflict, and the US downplayed the necessity of further military strikes.  The latest report from the International Energy Agency (IEA) also weighed on oil price gains. On Friday, the IEA lowered its fourth-quarter forecast, estimating a global crude oil supply surplus of 1.7 million to 2 million barrels per day. The report stated that global crude oil production surged by 2.3 million barrels per day in October, reversing the supply-demand balance. In addition, China's refining volume declined by 8.1% year-on-year in October, indicating weakening demand in the world's largest crude oil importer. The latest weekly inventory data from the American Petroleum Institute (API) and the Energy Information Administration (EIA) also made bullish traders hesitant to restart their bullish expectations. EIA data showed that U.S. commercial crude oil inventories increased by nearly 5 million barrels last week, while domestic crude oil production remained high at around 14.01 million barrels per day. This week, traders will focus on whether U.S. crude oil inventories will continue to rise from their multi-year lows in October; they will also closely monitor refinery utilization rates and distillate fuel inventories—tight global diesel supply has been supporting crack spreads. Finally, the near-month WTI crude oil contract is about to expire, which is likely to cause volatility; the statements from OPEC+ ministers regarding December production quotas are also worth noting. December WTI crude oil futures weekly technical analysis.
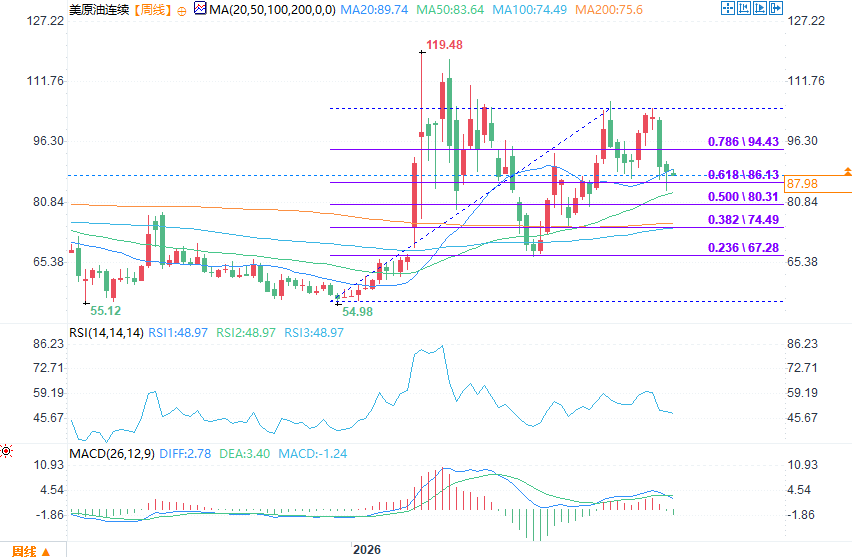 The war premium has been largely priced in, and oil prices opened slightly lower this week. Looking at the weekly chart, the main trend is downward. A break below $83.88 would signal a resumption of the downtrend; only a break above $104.99 would signal an uptrend. Long-term trading range: $55.63 – $104.99. The retracement support zone within this range is $80.31 to $74.49, with the 52-week moving average at $75.55, forming a dense support zone between $75.55 and $74.49. Medium-term trading range: $66.98 – $104.99. The retracement range of $85.99 – $81.50 saw the price find support at $83.88 last week. This range has now become support at the start of this week. New short-term range: $104.99 – $83.88. If a counter-trend rebound occurs, oil prices may test the retracement range of $94.44–$96.93, but the overall trend remains bearish. Above the main high of $104.99, there are previous long-term highs at $106.75, $107.77, and $111.03. December WTI crude oil futures
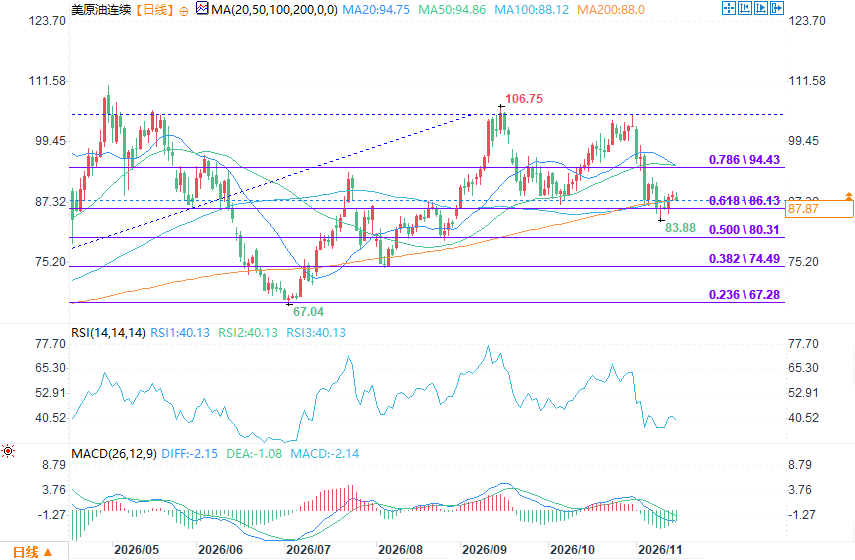 The weekly trend has turned bearish, so my bias is towards further declines. However, the current price action suggests a potential short-covering rally that could push the price towards the $94.44–$96.93 range, but the overall trend remains downward. If bears attempt to push the price below $83.88, they may encounter buying support around $81.50–$80.31. If this support level breaks, the bears will target the $80.31–$74.49 retracement range, which is attractive to aggressive contrarian buyers looking to buy on dips. A faster break below this level would target the next support zone at $75.55–$74.49.
The latest report from the International Energy Agency (IEA) also weighed on oil price gains. On Friday, the IEA lowered its fourth-quarter forecast, estimating a global crude oil supply surplus of 1.7 million to 2 million barrels per day. The report stated that global crude oil production surged by 2.3 million barrels per day in October, reversing the supply-demand balance. In addition, China's refining volume declined by 8.1% year-on-year in October, indicating weakening demand in the world's largest crude oil importer. The latest weekly inventory data from the American Petroleum Institute (API) and the Energy Information Administration (EIA) also made bullish traders hesitant to restart their bullish expectations. EIA data showed that U.S. commercial crude oil inventories increased by nearly 5 million barrels last week, while domestic crude oil production remained high at around 14.01 million barrels per day. This week, traders will focus on whether U.S. crude oil inventories will continue to rise from their multi-year lows in October; they will also closely monitor refinery utilization rates and distillate fuel inventories—tight global diesel supply has been supporting crack spreads. Finally, the near-month WTI crude oil contract is about to expire, which is likely to cause volatility; the statements from OPEC+ ministers regarding December production quotas are also worth noting. December WTI crude oil futures weekly technical analysis. The war premium has been largely priced in, and oil prices opened slightly lower this week. Looking at the weekly chart, the main trend is downward. A break below $83.88 would signal a resumption of the downtrend; only a break above $104.99 would signal an uptrend. Long-term trading range: $55.63 – $104.99. The retracement support zone within this range is $80.31 to $74.49, with the 52-week moving average at $75.55, forming a dense support zone between $75.55 and $74.49. Medium-term trading range: $66.98 – $104.99. The retracement range of $85.99 – $81.50 saw the price find support at $83.88 last week. This range has now become support at the start of this week. New short-term range: $104.99 – $83.88. If a counter-trend rebound occurs, oil prices may test the retracement range of $94.44–$96.93, but the overall trend remains bearish. Above the main high of $104.99, there are previous long-term highs at $106.75, $107.77, and $111.03. December WTI crude oil futures The weekly trend has turned bearish, so my bias is towards further declines. However, the current price action suggests a potential short-covering rally that could push the price towards the $94.44–$96.93 range, but the overall trend remains downward. If bears attempt to push the price below $83.88, they may encounter buying support around $81.50–$80.31. If this support level breaks, the bears will target the $80.31–$74.49 retracement range, which is attractive to aggressive contrarian buyers looking to buy on dips. A faster break below this level would target the next support zone at $75.55–$74.49.
- Risk Warning and Disclaimer
- The market involves risk, and trading may not be suitable for all investors. This article is for reference only and does not constitute personal investment advice, nor does it take into account certain users’ specific investment objectives, financial situation, or other needs. Any investment decisions made based on this information are at your own risk.