Gold prices rebounded slightly in Asian trading but failed to reverse the overall weakness: multiple negative factors weighed on the market, with $3,880 becoming a key watershed.
2026-11-17 14:42:31
On Tuesday (November 17) during Asian trading hours, spot gold steadily rose, supported by a slight pullback in the US dollar from a 19-month high, recovering from its lows since October 2025. However, market expectations for a Federal Reserve rate hike remain strong, coupled with escalating geopolitical risks in the Middle East, limiting the downside potential of the dollar. This will significantly limit the rebound in gold prices, and bullish traders need to remain cautious.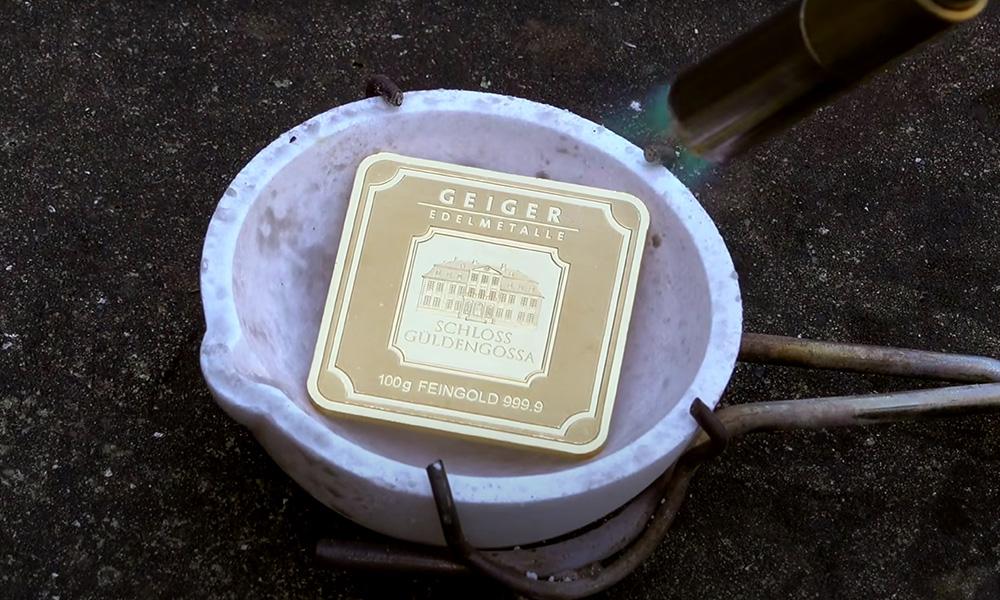
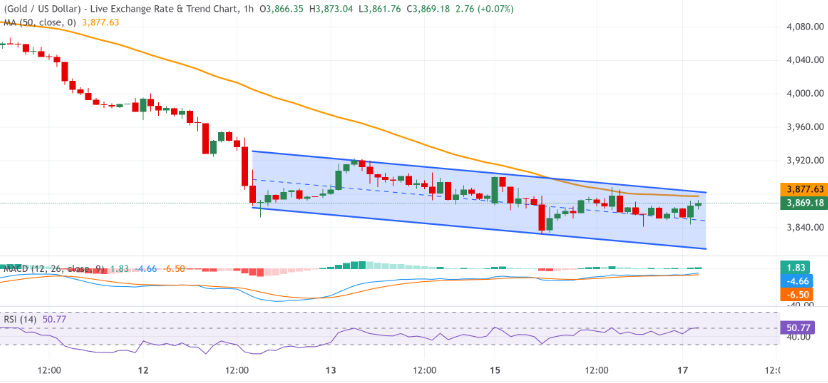 Chart: Spot Gold Price Hourly Technical Chart
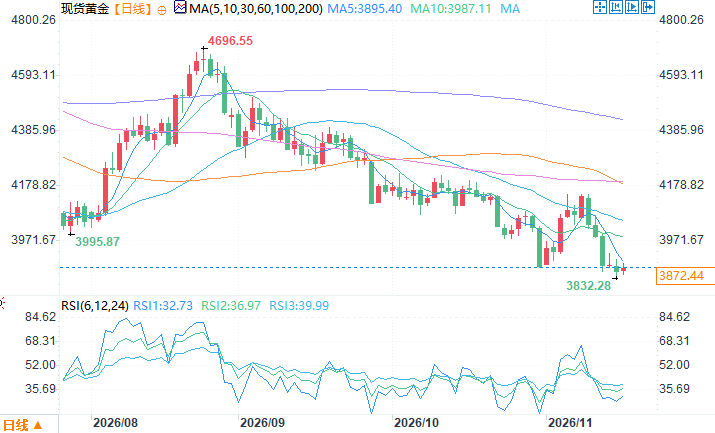 Spot gold daily chart source: FX678. At 14:40 Beijing time on November 17th, spot gold was trading at $3874.44 per ounce.
With expectations of interest rate hikes remaining high, US Treasury yields continue to exert significant downward pressure.
Strong US inflation data coupled with hawkish comments from Federal Reserve officials have led traders to widely anticipate further monetary tightening by the Fed. According to the CME Group's FedWatch tool, the market has fully priced in a 25 basis point rate hike at the December meeting, with the possibility of a smaller 50 basis point hike remaining. This expectation supports high US Treasury yields, with the 10-year Treasury yield firmly above 5%, near a one-month high. The high-yield environment continues to diminish the attractiveness of gold, a non-interest-bearing asset. Unless interest rate expectations ease significantly, it will be difficult for gold prices to experience a sustained surge.The situation in the Middle East is complex and volatile, leading to a surge in safe-haven funds towards the US dollar.
The geopolitical situation in the Middle East remains volatile. Iranian Foreign Minister Abbas Araghchi stated that Iran is still willing to resolve disputes peacefully through diplomacy, but the US has chosen a confrontational approach. Meanwhile, the US Navy has deployed its third aircraft carrier, the USS Theodore Roosevelt, to the Middle East, and related diplomatic negotiations have stalled. Risks in the Strait of Hormuz continue to escalate, with the Iranian Navy reporting that four oil tankers struck mines and caught fire in the restricted waters of the strait in the past 24 hours. This type of geopolitical conflict has led to safe-haven buying primarily in the US dollar, having a limited positive effect on gold. Instead, it has supported the dollar, indirectly limiting the upside potential for gold prices. The overall fundamental environment is more favorable for the US dollar, making gold more likely to experience a pullback after a rally in the short term.Key data releases and meeting minutes are about to be released, potentially acting as a catalyst for market movements.
During the North American trading session, US retail sales data will be released, and several key Federal Reserve members will deliver speeches. However, the market's primary focus will be on the upcoming release of the Fed's policy meeting minutes. Traders will glean insights from the minutes regarding officials' attitudes towards the future path of interest rate hikes. This information will reshape market interest rate pricing, providing new short-term volatility drivers for gold and serving as a key focus for market movements going forward. Until these important signals are released, gold prices are likely to maintain a consolidation and correction pattern. Chart: Spot Gold Price Hourly Technical ChartTechnically, the market is in a downward trend; $3880 is the key level to determine whether the market is bullish or bearish.
From a technical perspective, gold prices are trading within a downward parallel channel. The 50-hour simple moving average is around $3877.63, forming a confluence of resistance levels with the upper channel line at $3882.09. On the hourly chart, the MACD indicator is in positive territory, and the RSI is near neutral at 50.77, indicating only a consolidation phase and not a reversal of the downtrend. Only a firm hold above the confluence resistance around $3880 can alleviate the bearish bias and allow gold to challenge the resistance levels of $3900 and $3925. Initial support on the downside is at the overnight low of $3832, with stronger support at the lower channel line at $3814.58 and the $3800 level. A break below these levels would reignite the downtrend.Conclusion
This rebound in gold prices is merely a correction following a temporary pullback in the US dollar; the two major negative factors—expectations of a Fed rate hike and geopolitical risks in the Middle East—have not yet subsided. The key in the short term is whether it can break through the $3880 resistance level. Before a successful breakout, the rebound will likely encounter selling pressure, and the overall downward trend remains fundamentally unchanged. Spot gold daily chart source: FX678. At 14:40 Beijing time on November 17th, spot gold was trading at $3874.44 per ounce.
- Risk Warning and Disclaimer
- The market involves risk, and trading may not be suitable for all investors. This article is for reference only and does not constitute personal investment advice, nor does it take into account certain users’ specific investment objectives, financial situation, or other needs. Any investment decisions made based on this information are at your own risk.