Gold prices continued to plummet, with panic selling triggering an abnormal drop.
2026-11-20 15:50:32
The market is widely discussing the Federal Reserve's continued hawkish stance as the core negative factor suppressing gold, a logic I highlighted a week ago. Simultaneously, gold prices are undergoing rapid clearing, with significantly increased volatility, making it a test of trading skills. Following the midterm elections, US employment and inflation data have been released, and the narrative of interest rate hikes is resonating, with the market repricing a "higher and longer" interest rate path. However, today's market exhibited an anomaly: the dollar weakened, and US Treasury yields declined in tandem. According to traditional pricing frameworks, this should be beneficial for gold, yet gold prices continued to fall. Here, we need to clarify the underlying trading logic. 
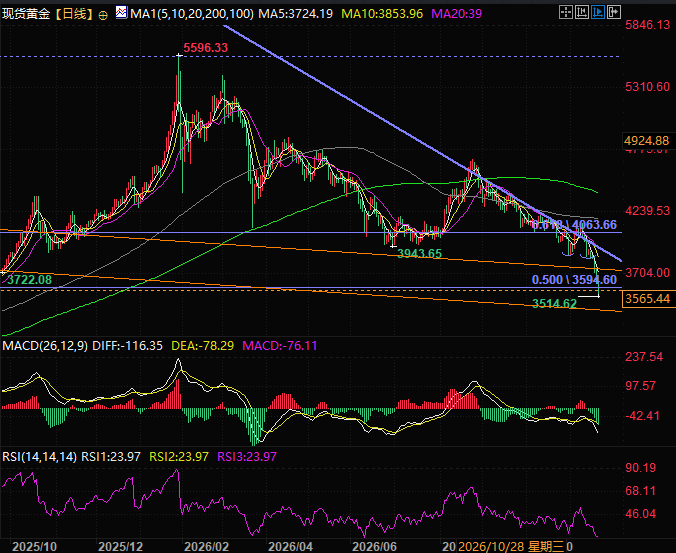 (Spot gold daily chart, source: EasyTrade) At 15:49 Beijing time, spot gold is currently trading at $3,560 per ounce.
Underlying negative factors: Hawkish expectations from the Federal Reserve and persistently high interest rates are suppressing gold prices.
The core driver of this round of gold price decline is the hawkish signals continuously released by the Federal Reserve. Chicago Fed President Goolsby publicly stated that in the face of stubborn inflation, the Fed will not rule out any policy options, and the interest rate hike toolbox is ready at any time. This is also a microcosm of the recent collective hawkish stance of many Fed officials. The 10-year US Treasury yield has remained firmly above 5%, and market trading expectations have changed significantly: even if the Fed, ECB, and Bank of England end their interest rate hike cycles, the high-interest-rate environment will persist for a long time. Gold is a non-interest-bearing asset, and rising interest rates and US Treasury yields directly increase the opportunity cost of holding gold. Funds will continue to shift to assets that can steadily generate interest, such as the US dollar and US Treasuries. This is the most basic macroeconomic logic suppressing gold prices.The second layer of pressure: a sell-off in the AI sector, triggering cross-market liquidity withdrawal.
Besides interest rate expectations, the sell-off in the AI sector constitutes the second major negative factor weighing on gold. Global stock markets continue to weaken, and the market is beginning to reassess the valuation bubble in the AI sector, resulting in significant paper losses for many investors. When accounts need margin calls to cover stock losses, gold, with its high liquidity and easy conversion into cash, becomes a "withdrawal pool" for funds. Gold no longer plays its traditional safe-haven role; instead, it is being sold off in a concentrated manner, with both stocks and gold falling in tandem, breaking the previous pattern of safe-haven trading. The geopolitical premium previously driven by the US-Iran conflict has been quickly cleared under the dual pressure of high interest rates and liquidity withdrawal, causing gold prices to fall from their peak by nearly one-third.Analysis of Abnormal Market Trends: Why is Gold Falling Despite Weakening Dollar and US Treasury Bonds?
Today's market saw a phenomenon that puzzled many: the dollar weakened and US Treasury yields declined. According to classic models, these should be bullish for gold, yet prices continued to fall. The root cause lies in the market structure and panic selling. During the decline, long positions and short-term funds entered the market to try and buy the dip, but prices failed to stabilize. As the market continued to fall, long positions suffered increasing losses, leading to a surge in stop-loss orders and leveraged liquidations. Another easily overlooked type of selling pressure is the emotional buying: after losses continued to mount, some traders, to alleviate psychological pain, proactively closed their positions, turning former longs into shorts. This layered selling pressure created a negative feedback loop that accelerated the decline. While macroeconomics determines the medium- to long-term direction, short-term market movements are often driven by leveraged positions, stop-loss orders, and trading sentiment.Summary and Technical Analysis:
The advantage of technical analysis lies in its ability to predict market consensus. Certain price levels consistently attract buying interest and a reluctance to sell. However, when you observe weak price rebounds near key levels, this is a prelude to a potential break below those levels, potentially triggering panic. For example, the important level of 3600, while seemingly fraught with risk when broken, actually provides ample reasons to buy gold, especially in the short term. Opportunities arise from declines, while risks emerge from rallies. However, many in the market do the opposite, ultimately selling at a loss at the lowest point. Above 3500 presents a very attractive buying opportunity, as there's a high probability that gold will retest 3600 or consolidate around that level later. Technically, the MACD shows no divergence, but the RSI is significantly oversold. A rebound is already underway, but currently, it's crucial to wait for gold to stabilize and rebound; chasing higher prices is risky. (Spot gold daily chart, source: EasyTrade) At 15:49 Beijing time, spot gold is currently trading at $3,560 per ounce.
- Risk Warning and Disclaimer
- The market involves risk, and trading may not be suitable for all investors. This article is for reference only and does not constitute personal investment advice, nor does it take into account certain users’ specific investment objectives, financial situation, or other needs. Any investment decisions made based on this information are at your own risk.