Gold prices fall below $3,600: Is this an oversold rebound window or a continuation of the downtrend?
2026-11-20 21:18:32
On November 20th, spot gold briefly dipped below the $3600 mark during trading. Since reaching a historical high of around $5595 in January of this year, the maximum pullback in gold prices has exceeded 35%, leading many traders to debate whether the long-running gold bull market has come to an end. Analysis from institutions such as UBS, JPMorgan Chase, and the World Gold Council suggests a relatively balanced conclusion: the fundamental long-term demand for gold remains unshaken, but the short-term macroeconomic environment has shifted entirely towards a bearish trend. While there is potential for a rebound after being oversold, a bottom has not yet been confirmed, and it is not advisable to treat this as a trend reversal at this stage. 
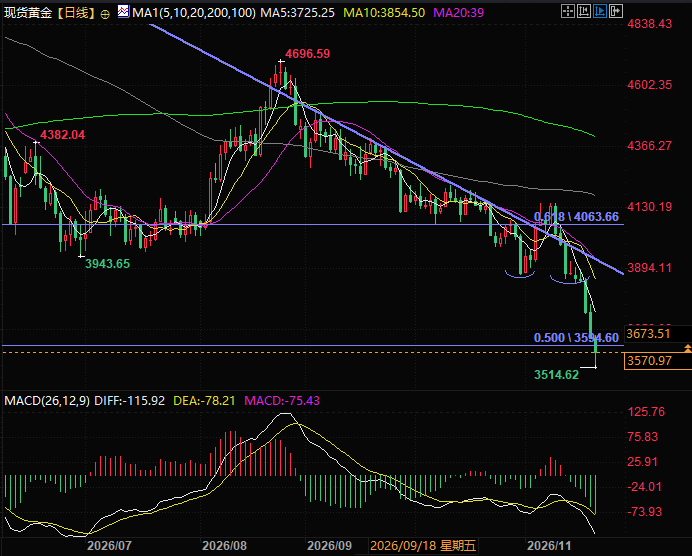 (Spot gold daily chart, source: EasyTrade) At 21:15 Beijing time, spot gold is currently trading at $3,570 per ounce.
Real interest rates and the US dollar are driving this round of gold price declines.
The root cause of this gold sell-off is the market's repricing of the Federal Reserve's monetary policy. Sticky inflation, coupled with the Fed's hawkish stance, has continuously pushed up US Treasury yields and the US dollar. The US 10-year real yield recently rose to 2.63%, while the dollar index is approaching a 19-month high, putting double pressure on gold. Gold itself does not generate interest, so higher real yields directly increase the opportunity cost of holding gold; a stronger dollar also increases the cost for overseas investors to buy gold, further suppressing external buying. UBS specifically noted that this decline is not simply due to exchange rate fluctuations; gold priced in euros, pounds, Swiss francs, and yen also saw similar drops, indicating that investors are actively reducing their gold exposure. Fidelity analyst Julien Timmer added from a liquidity perspective that gold prices often benefit from monetary expansion cycles, while global liquidity growth is currently slowing. In short, the long-term logic for gold has not disappeared; only short-term pricing power has shifted to real interest rates, the US dollar, and liquidity.Market characteristics: Buying activity is lacking, but panic selling has not yet occurred.
UBS summarized the current market situation as "no buying pressure, but no stampede-like sell-off." After gold prices fell below $3,800, the anticipated bargain hunters failed to materialize; however, on the other hand, gold ETF holders and long-term investors did not engage in a large-scale sell-off. This round of decline is more a result of marginal buying exhaustion coupled with amplified volatility from algorithmic selling, rather than a collective market abandonment of gold assets. Under this structure, gold prices can experience a technical rebound, but a rebound does not equate to a confirmed bottom. JPMorgan's positioning model shows that gold short positions have reached the 89th percentile since 2020, indicating a high degree of short crowding. Historically, in 11 similar high-short-covering scenarios, gold prices rose three months later in 10 of them, with a median increase of 5.2%, meaning that any positive catalyst can easily trigger a short-term rebound due to short covering. However, traders need to pay attention to the details of CFTC positioning: as of November 10, net positions in asset management accounts are still near the historical average, and the total amount of explicit short positions is not extreme. This signal should only be interpreted as an increased probability of a short-term rebound; it cannot be definitively said that a strong short squeeze will occur or that a bull market will resume.ETF fund flows are the most crucial signal to watch going forward.
The shift in ETF funds will determine the nature of this correction. Before November 13th, global gold ETFs generally maintained a slight inflow, indicating that the confidence of long-term investors remained solid. However, data from the world's largest gold ETF (GLD) changed: from November 16th to November 19th, holdings decreased by nearly 8 tons, indicating an outflow of funds. The distinguishing criteria in trading are clear: if ETF redemptions stop quickly, this round of correction is merely a market reset driven by macroeconomic expectations and algorithmic positions; if North American gold ETFs continue to see redemptions for several weeks, it means that selling pressure has spread from short-term speculative positions to long-term investors, and the negative impact will significantly escalate.The central bank's gold purchases will provide long-term support, but will not offer a hard price floor.
Data from the World Gold Council continues to support the long-term value of gold: central banks worldwide purchased a total of 321 tons of gold in the third quarter, bringing their year-to-date purchases to 675 tons, a 6% year-on-year increase. Fiscal risks, diversification of foreign exchange reserves, and geopolitical shifts continue to solidify gold's strategic allocation attributes. However, central banks are long-term investment funds and will not rigidly adhere to any particular price level. Central bank buying can absorb some supply and support a long-term bottom when gold prices weaken, but it is difficult to prevent a short-term downward trend. UBS has identified two important support levels: $3540 and $3442; while the first sign of strength above is a price stabilization above $3890.Trading Outlook: During the bottoming phase within a range, a triple confirmation signal is needed.
Summarizing signals from various institutions, three core judgments can be made: First, the central bank's continued gold purchases have not disrupted the long-term investment logic for gold; Second, short-selling pressure is high, presenting a tactical rebound opportunity; Third, the trend has not reversed, with real yields and the US dollar remaining strong. While the GLD physical gold ETF has shown signs of capital outflow, ETF funds are essentially chasing highs and lows, consistent with gold's technical pattern. Currently, gold is in a downtrend and needs time to recover before ETF funds can resume normal operations. The $3540-$3890 range can only be considered a potential bottoming range, not a confirmed bottom. For a trend reversal and the start of a new round of gains to be confirmed, three conditions need to be met simultaneously: a decline in US Treasury real yields and a weakening US dollar; stabilization of gold ETF holdings; and a sustained strengthening of gold prices above $3890. Until all conditions are met, even if gold prices rebound, they will remain in a downtrend. Short-term trading is suitable for betting on oversold rebounds, but heavy bottom-fishing and chasing the market carries significant risks. (Spot gold daily chart, source: EasyTrade) At 21:15 Beijing time, spot gold is currently trading at $3,570 per ounce.
- Risk Warning and Disclaimer
- The market involves risk, and trading may not be suitable for all investors. This article is for reference only and does not constitute personal investment advice, nor does it take into account certain users’ specific investment objectives, financial situation, or other needs. Any investment decisions made based on this information are at your own risk.