Gold recorded its worst weekly performance since March, with expectations of a Fed rate hike and passive selling putting downward pressure on prices.
2026-11-21 01:04:33
On Friday (November 20), spot gold came under pressure and fell, hitting its lowest level since September 2025 during the Asian session before extending its losses by more than 2%. A global stock market crash exacerbated market volatility, and Anthropic's record IPO failed to alleviate concerns about overvaluation of AI. Spot gold traded around $3,550, higher than the intraday low of $3,514.  The Nasdaq Composite and Dow Jones Industrial Average both fell more than 6% this week, while the S&P 500 dropped 5.75%. Amid the stock market downturn, some investors opted to sell gold to raise cash and offset losses in other assets. The stock market crash also boosted demand for Treasury bonds, driving down yields. The benchmark yield on the 10-year U.S. Treasury note fell more than 13 basis points, breaking below the 5% mark. The decline in Treasury yields put pressure on the dollar, alleviating some of the downward pressure on gold. The Dollar Index (DXY), which measures the dollar against six major currencies, fell from a 19-month high of 103.97 reached on Thursday to 103.75. Even so, gold is still on track for its worst weekly performance in eight months, as the market prepares for a more aggressive tightening cycle from the Federal Reserve. According to the CME FedWatch Tool, the market has almost fully priced in a 25-basis-point rate hike by the Fed in December; several Fed officials have expressed concern about persistently high inflation, and the market also expects interest rates to rise further in 2027. Philadelphia Fed President Anna Paulson said on Thursday that the Fed needs to raise interest rates again because inflation remains too high. Chicago Fed President Austan Goolsby also pointed out that there is little evidence that inflation will fall back to the 2% target on its own. Gold itself does not generate interest, and the prospect of rate hikes will reduce the attractiveness of holding gold. The Fed's hawkish expectations will provide overall support for the dollar; a stronger dollar will increase the cost for buyers using other currencies to purchase gold. Looking ahead, traders will focus on the final University of Michigan consumer sentiment report (with a focus on inflation expectations data) and Fed Governor Lisa Cook's speech for new clues about the interest rate path. Ryan McKay and Bart Melek of TD Securities believe that gold has encountered strong selling pressure due to increased market risk aversion and the Fed's hawkish stance. Currently, hedge funds already hold long positions in gold and short positions, and the likelihood of them further increasing their gold positions in the future is reduced. However, they believe this does not mean that the upward trend in gold has completely ended, as some structural problems still exist. The fiscal-driven stock market sentiment and stagflation continue to provide long-term upward momentum, while strong ETF holdings and potential short-term buying by CTA funds could provide short-term benefits. Technical Analysis: The RSI is near 25, indicating oversold conditions, but bears still dominate.
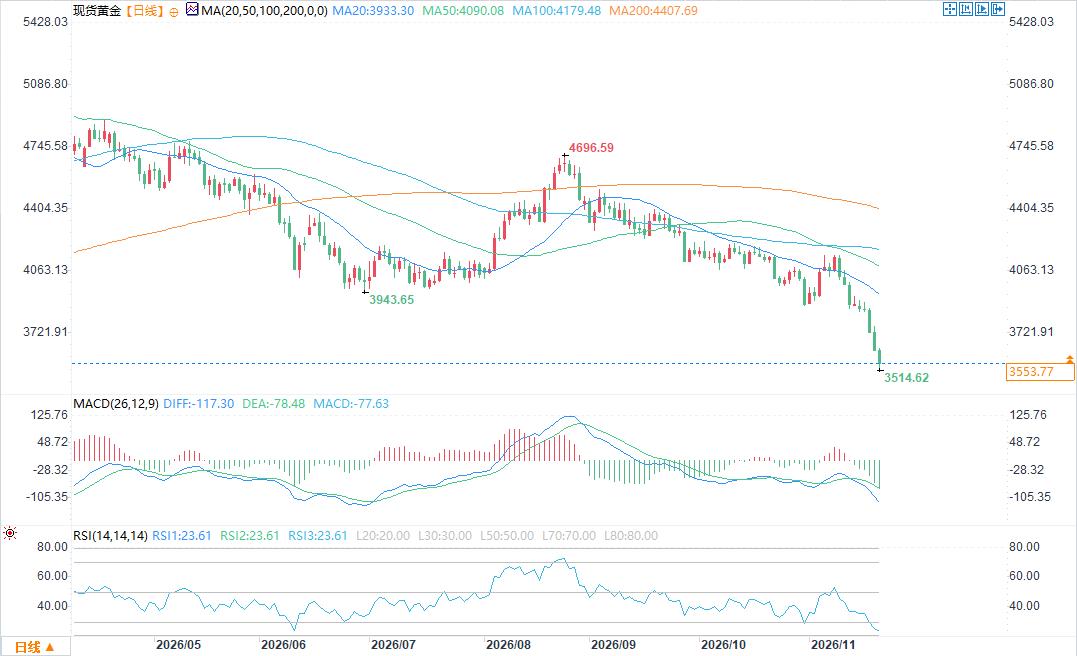 On the daily chart, spot gold is quoted at $3586.84, continuing its downward trend. The spot gold price is well below the 21-day, 50-day, 100-day, and 200-day simple moving averages, which are acting as resistance levels, suggesting a continued downtrend. Momentum indicators also confirm this bearish pattern: the Relative Strength Index (RSI) has slipped into oversold territory near 25; the MACD indicator is in deep negative territory; and the Average Directional Movement Index (ADX) has risen above 30, indicating that the current downtrend is strengthening rather than a simple correction. On the upside, initial resistance is at $3600, followed by $3700; stronger resistance lies near the 21-day moving average at $3938. Further up, the 50-day moving average at $4091, the 100-day moving average at $4180, and the 200-day moving average at $4408 form a strong resistance level, limiting the upside potential for gold. On the downside, the key support level is at $3,500; as long as gold prices continue to be constrained by multiple moving average resistance levels above, the bears will control the market.
The Nasdaq Composite and Dow Jones Industrial Average both fell more than 6% this week, while the S&P 500 dropped 5.75%. Amid the stock market downturn, some investors opted to sell gold to raise cash and offset losses in other assets. The stock market crash also boosted demand for Treasury bonds, driving down yields. The benchmark yield on the 10-year U.S. Treasury note fell more than 13 basis points, breaking below the 5% mark. The decline in Treasury yields put pressure on the dollar, alleviating some of the downward pressure on gold. The Dollar Index (DXY), which measures the dollar against six major currencies, fell from a 19-month high of 103.97 reached on Thursday to 103.75. Even so, gold is still on track for its worst weekly performance in eight months, as the market prepares for a more aggressive tightening cycle from the Federal Reserve. According to the CME FedWatch Tool, the market has almost fully priced in a 25-basis-point rate hike by the Fed in December; several Fed officials have expressed concern about persistently high inflation, and the market also expects interest rates to rise further in 2027. Philadelphia Fed President Anna Paulson said on Thursday that the Fed needs to raise interest rates again because inflation remains too high. Chicago Fed President Austan Goolsby also pointed out that there is little evidence that inflation will fall back to the 2% target on its own. Gold itself does not generate interest, and the prospect of rate hikes will reduce the attractiveness of holding gold. The Fed's hawkish expectations will provide overall support for the dollar; a stronger dollar will increase the cost for buyers using other currencies to purchase gold. Looking ahead, traders will focus on the final University of Michigan consumer sentiment report (with a focus on inflation expectations data) and Fed Governor Lisa Cook's speech for new clues about the interest rate path. Ryan McKay and Bart Melek of TD Securities believe that gold has encountered strong selling pressure due to increased market risk aversion and the Fed's hawkish stance. Currently, hedge funds already hold long positions in gold and short positions, and the likelihood of them further increasing their gold positions in the future is reduced. However, they believe this does not mean that the upward trend in gold has completely ended, as some structural problems still exist. The fiscal-driven stock market sentiment and stagflation continue to provide long-term upward momentum, while strong ETF holdings and potential short-term buying by CTA funds could provide short-term benefits. Technical Analysis: The RSI is near 25, indicating oversold conditions, but bears still dominate. On the daily chart, spot gold is quoted at $3586.84, continuing its downward trend. The spot gold price is well below the 21-day, 50-day, 100-day, and 200-day simple moving averages, which are acting as resistance levels, suggesting a continued downtrend. Momentum indicators also confirm this bearish pattern: the Relative Strength Index (RSI) has slipped into oversold territory near 25; the MACD indicator is in deep negative territory; and the Average Directional Movement Index (ADX) has risen above 30, indicating that the current downtrend is strengthening rather than a simple correction. On the upside, initial resistance is at $3600, followed by $3700; stronger resistance lies near the 21-day moving average at $3938. Further up, the 50-day moving average at $4091, the 100-day moving average at $4180, and the 200-day moving average at $4408 form a strong resistance level, limiting the upside potential for gold. On the downside, the key support level is at $3,500; as long as gold prices continue to be constrained by multiple moving average resistance levels above, the bears will control the market.
- Risk Warning and Disclaimer
- The market involves risk, and trading may not be suitable for all investors. This article is for reference only and does not constitute personal investment advice, nor does it take into account certain users’ specific investment objectives, financial situation, or other needs. Any investment decisions made based on this information are at your own risk.