One chart shows 18 direct foreign exchange support and resistance: US dollar + European and Japanese + commodity currencies + emerging currencies (July 29, 2025)
2025-07-29 14:24:18
One chart to see the support and resistance of the straight market: US dollar + European and Japanese currencies + commodity currencies + emerging currencies, updated on Tuesday, July 29, 2025 at 14:15, specifically USD/Euro/JPY/GBP/CHF/ANZCAD+RMB/HKD/RUB/RAND/KRON and other 18 straight markets, for more details, see the content in Xiruo's special chart.
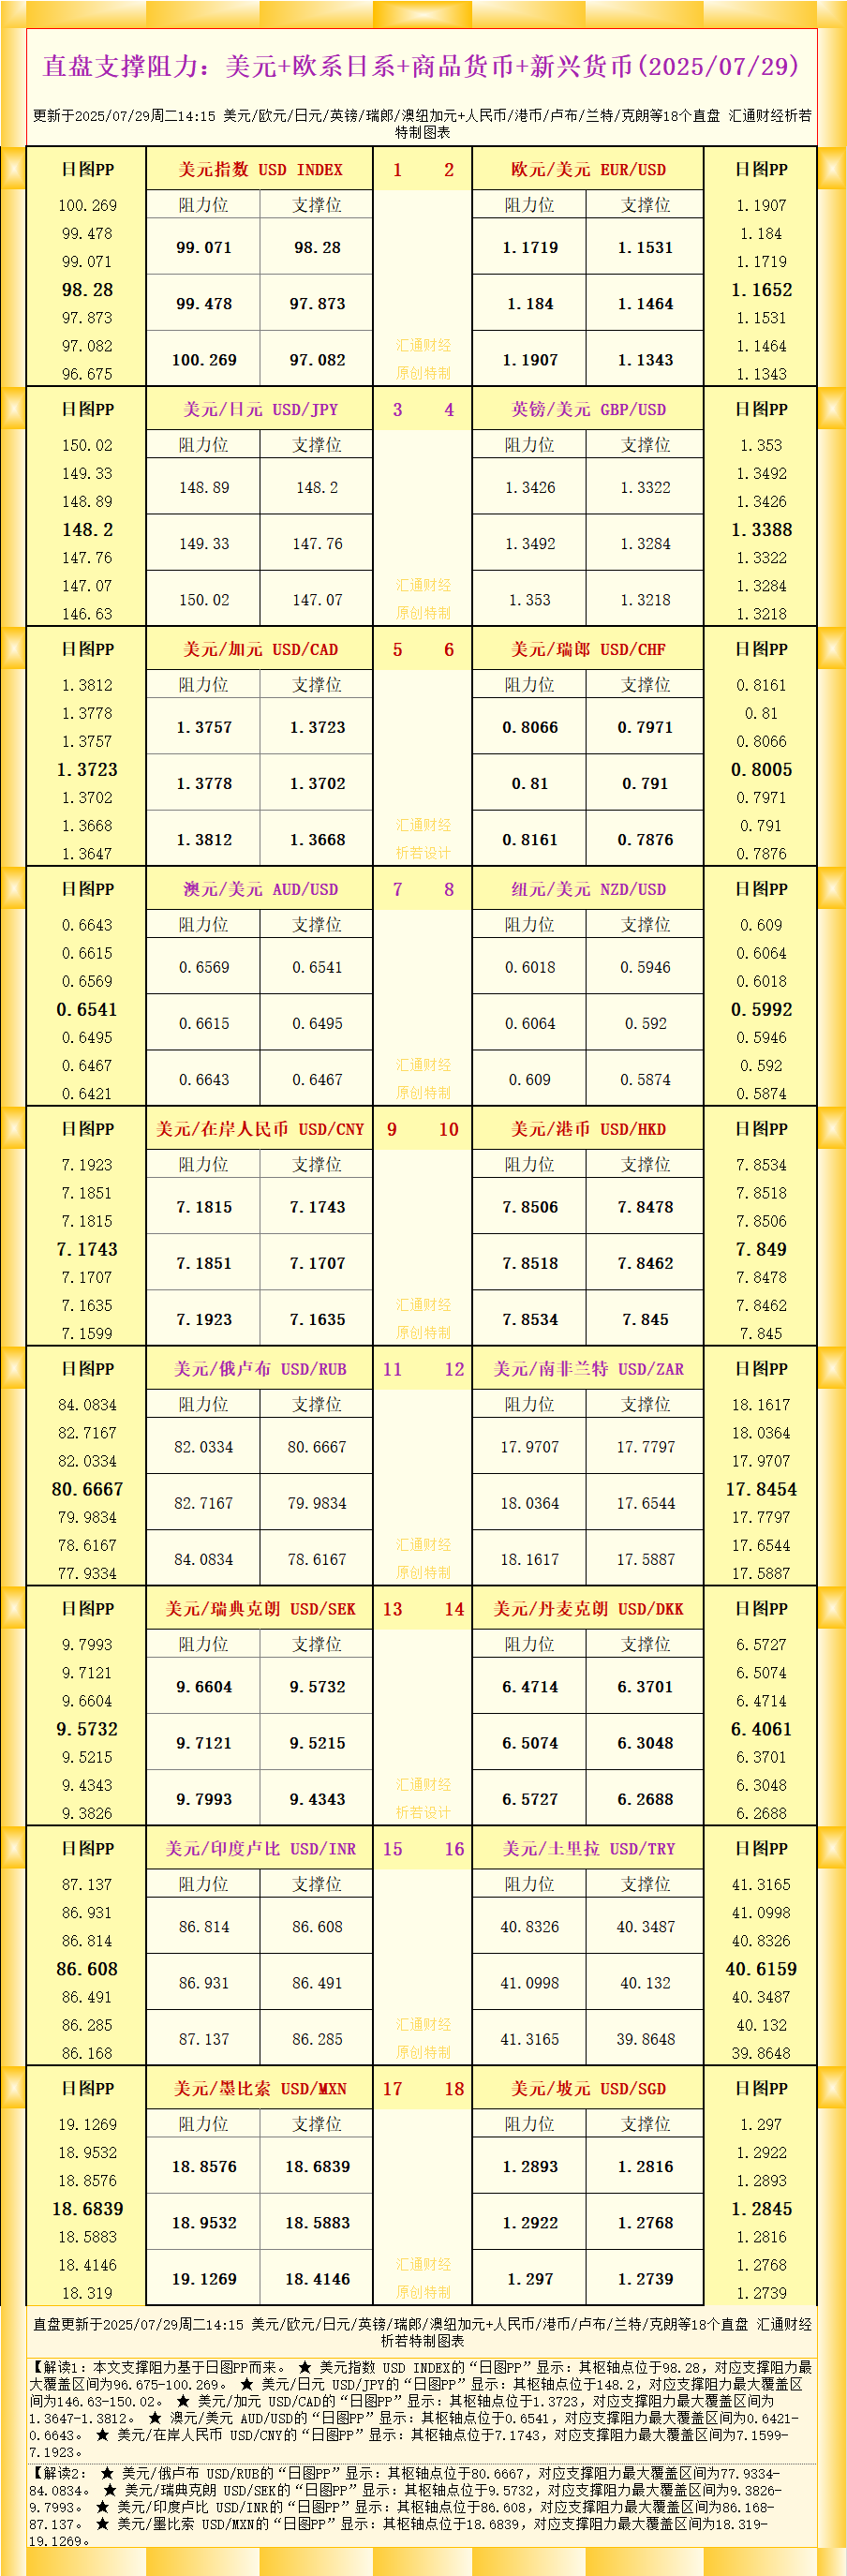
As shown in the data, Interpretation 1: The support and resistance in this article are based on the daily chart PP.
★ The "Daily PP" of the US Dollar Index USD INDEX shows that its pivot point is at 98.28, and the corresponding maximum support and resistance range is 96.675-100.269.
★ The "Daily PP" of USD/JPY shows that its pivot point is at 148.2, and the corresponding maximum support and resistance range is 146.63-150.02.
★ The "Daily PP" of USD/CAD shows that its pivot point is at 1.3723, and the corresponding maximum support and resistance range is 1.3647-1.3812.
★ The "Daily PP" of Australian Dollar/US Dollar AUD/USD shows that its pivot point is at 0.6541, and the corresponding maximum support and resistance range is 0.6421-0.6643.
★ The "Daily PP" of the USD/CNY shows that its pivot point is at 7.1743, and the corresponding maximum support and resistance range is 7.1599-7.1923.
Interpretation 2:
★ The "Daily PP" of the USD/RUB shows that its pivot point is at 80.6667, and the corresponding maximum support and resistance range is 77.9334-84.0834.
★ The "Daily PP" of USD/SEK shows that its pivot point is at 9.5732, and the corresponding maximum support and resistance range is 9.3826-9.7993.
★ The "Daily PP" of the US Dollar/Indian Rupee USD/INR shows that its pivot point is at 86.608, and the corresponding maximum support and resistance range is 86.168-87.137.
★ The "Daily PP" of the USD/MXN shows that its pivot point is at 18.6839, and the corresponding maximum support and resistance range is 18.319-19.1269.
For more information on varieties, please refer to the chart. Originally created by Huitong Finance, all rights reserved, for reference only.
- Risk Warning and Disclaimer
- The market involves risk, and trading may not be suitable for all investors. This article is for reference only and does not constitute personal investment advice, nor does it take into account certain users’ specific investment objectives, financial situation, or other needs. Any investment decisions made based on this information are at your own risk.