The strong U.S. PPI in July weighed on gold futures, but the prospect of a Fed rate cut still provided support.
2025-08-15 10:09:07
Market participants entered the market on Thursday with higher expectations after encouraging CPI data released this week rekindled optimism about monetary policy easing in the second half of 2025. However, the PPI release provided a sobering reminder that inflationary pressures at the wholesale level remain persistent, sending ripples through commodity markets and challenging the prevailing narrative of an imminent rate cut.
The U.S. Bureau of Labor Statistics reported that the seasonally adjusted PPI final demand index surged 0.9% in July, a sharp acceleration from the flat reading in June and the 0.4% increase in May. On an annual basis, the index rose 3.3% in the 12 months ending in July, the largest year-on-year increase since the 3.4% increase recorded in February 2025.
Perhaps more worrying for policymakers is the core PPI indicator, which excludes the volatile food, energy, and trade services components. This closely watched indicator climbed 0.6% in July, the biggest monthly gain since a 0.9% increase in March 2022. In the 12 months through July, core final demand prices rose 2.8%, highlighting the breadth of inflationary pressures beyond the overall category.
Precious metals markets bore the brunt of the market reassessment following the PPI release. Gold futures plunged $30 in the four hours following the data release, hitting an intraday low of $3,375.50 before recovering slightly to settle at $3,382.30. This sell-off marked the second consecutive time that gold futures failed to establish a foothold above the key 50-day simple moving average.
A puzzling disconnect has emerged between gold's price action and broader market sentiment. Despite the sizzling PPI data, the CME Group's FedWatch tool continues to project a 90% probability of a September rate cut, suggesting that fixed income markets remain convinced of the Fed's dovish approach. While risk assets, including equities, have largely recovered from their initial weakness following the PPI release, gold has failed to participate in this rebound.
The divergence raises questions about gold’s current position in investor portfolios and whether the precious metal’s traditional role as a hedge against inflation and currency debasement is being challenged by changing market dynamics.
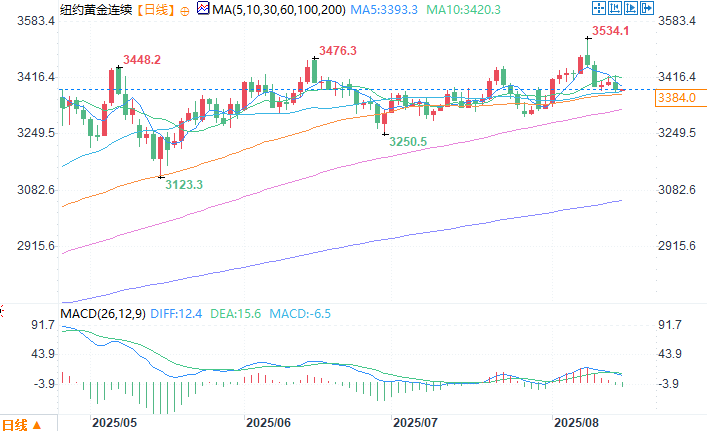
New York Gold Continuous Daily Chart Source: Yihuitong
At 10:07 Beijing time on August 15, the New York gold price was continuously quoted at $3384.4 per ounce.
Inflation data delivers unwelcome surprise
The U.S. Bureau of Labor Statistics reported that the seasonally adjusted PPI final demand index surged 0.9% in July, a sharp acceleration from the flat reading in June and the 0.4% increase in May. On an annual basis, the index rose 3.3% in the 12 months ending in July, the largest year-on-year increase since the 3.4% increase recorded in February 2025.
Perhaps more worrying for policymakers is the core PPI indicator, which excludes the volatile food, energy, and trade services components. This closely watched indicator climbed 0.6% in July, the biggest monthly gain since a 0.9% increase in March 2022. In the 12 months through July, core final demand prices rose 2.8%, highlighting the breadth of inflationary pressures beyond the overall category.
Gold technical chart deteriorates
Precious metals markets bore the brunt of the market reassessment following the PPI release. Gold futures plunged $30 in the four hours following the data release, hitting an intraday low of $3,375.50 before recovering slightly to settle at $3,382.30. This sell-off marked the second consecutive time that gold futures failed to establish a foothold above the key 50-day simple moving average.
Market paradox emerges
A puzzling disconnect has emerged between gold's price action and broader market sentiment. Despite the sizzling PPI data, the CME Group's FedWatch tool continues to project a 90% probability of a September rate cut, suggesting that fixed income markets remain convinced of the Fed's dovish approach. While risk assets, including equities, have largely recovered from their initial weakness following the PPI release, gold has failed to participate in this rebound.
The divergence raises questions about gold’s current position in investor portfolios and whether the precious metal’s traditional role as a hedge against inflation and currency debasement is being challenged by changing market dynamics.
New York Gold Continuous Daily Chart Source: Yihuitong
At 10:07 Beijing time on August 15, the New York gold price was continuously quoted at $3384.4 per ounce.
- Risk Warning and Disclaimer
- The market involves risk, and trading may not be suitable for all investors. This article is for reference only and does not constitute personal investment advice, nor does it take into account certain users’ specific investment objectives, financial situation, or other needs. Any investment decisions made based on this information are at your own risk.