U.S. Treasury yields have climbed, why is the U.S. dollar still "waiting there"?
2025-09-10 20:10:52
On Wednesday (September 10), the foreign exchange market was highly sensitive, with the US dollar index fluctuating around key technical levels. Market focus was on the upcoming release of the August Producer Price Index (PPI) and the Consumer Price Index (CPI) data the following day. The dollar's recent performance was supported by rising US Treasury yields, with the 10-year Treasury yield inching up to 4.09% and the 30-year yield climbing to 4.745%.
Meanwhile, market expectations for a rate cut at the Federal Reserve's September meeting continue to build, compounded by risk aversion fueled by tariff rhetoric. The dollar's performance presents a complex picture. Weak employment data has further fueled speculation about Fed policy, while technical indicators suggest the dollar index is facing a directional dilemma near key moving averages. The following analysis will examine the current dollar trend and future trends from both fundamental and technical perspectives.
The short-term performance of the US dollar is closely tied to fluctuations in US Treasury yields. On September 10th, the market observed a bearish flattening of the US Treasury yield curve, with 10-year and 30-year Treasury yields rising 2 and 3 basis points, respectively. This reflects investors' cautious stance regarding the upcoming PPI data and the $39 billion 10-year Treasury auction. Leading analysts indicate that the market expects the PPI to maintain its year-on-year growth rate of 3.3% in August, while the core PPI (excluding food and energy) is expected to decline slightly from 3.7% to 3.5%, both showing a month-on-month increase of 0.3%. While this figure represents a cooling from the 0.9% increase in July, it still indicates persistent inflationary pressures, particularly in the services sector, where sticky inflation may become a key variable. If the core PPI or tomorrow's CPI data indicate rising services sector inflation, the market may reprice US Treasury yields, driving further dollar strength.
Weak employment data adds uncertainty to the US dollar's trajectory. Preliminary data released by the US Bureau of Labor Statistics (BLS) on Tuesday showed a downward revision of 911,000 non-farm payrolls through March 2025, implying an average monthly loss of approximately 76,000 jobs. This significant revision confirms Federal Reserve official Christopher Waller's warning of a slowing labor market. Waller stated in July that private sector hiring was "close to stalling," a finding further vindicated by the release of the August employment report. The market generally expects the Federal Reserve to cut interest rates at next week's FOMC meeting, with both a 25 basis point and a 50 basis point probability under discussion. The possibility of a 50 basis point cut has increased due to the weak employment data. If PPI and CPI data do not show a significant deterioration in inflation, the Fed may favor a gradual approach to rate cuts, which would limit the dollar's upside. However, if inflation data exceeds expectations, the dollar could find support due to rising expectations of a rate hike.
Furthermore, the impact of tariff rhetoric on market sentiment cannot be ignored. The Supreme Court (SCOTUS) has accepted the White House's request to expedite its review of the legality of the relevant tariff policies, with oral arguments expected in November. This development could prolong the risk-averse sentiment seen in October and November, pushing up US Treasury yields and indirectly supporting the US dollar. Reputable analysts believe the impact of tariffs will likely be felt in the second half of 2025, primarily through commodity inflation reflected in the PPI and CPI data. However, the stickiness of service sector inflation will be a key focus for the Federal Reserve. If data indicates persistent inflationary pressures, market expectations for Fed policy could shift from easing to a wait-and-see approach, potentially leading to high volatility in the US dollar index.
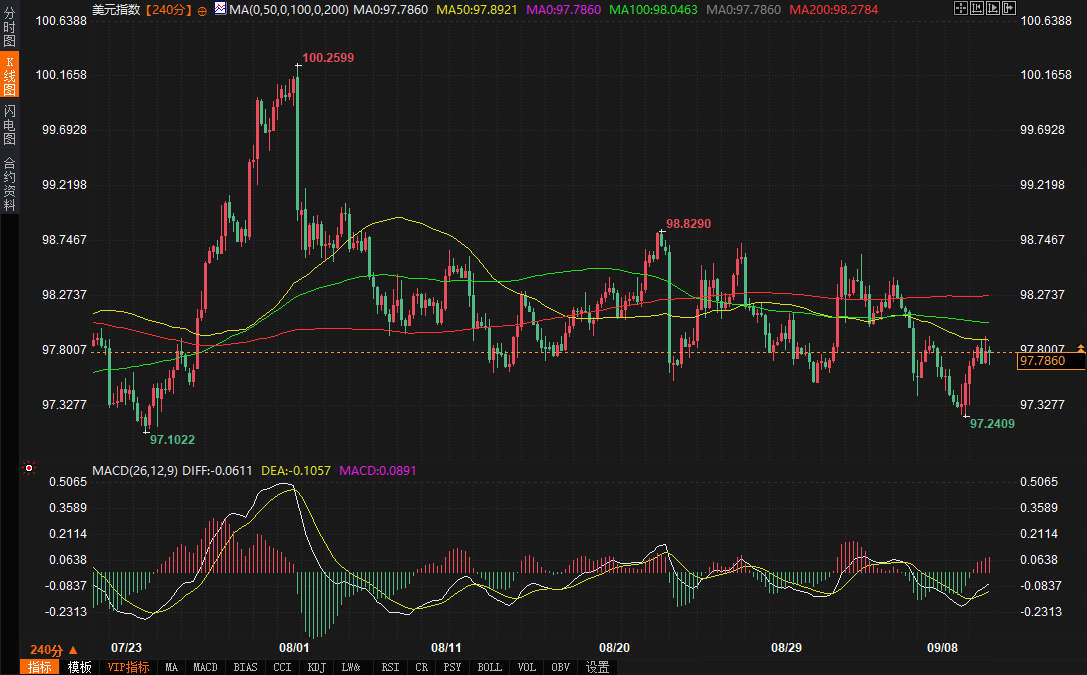
From a technical perspective, the performance of the US Dollar Index on the 4-hour chart warrants attention. The latest quotes indicate that the US Dollar Index has fluctuated slightly during the day, currently trading above the 50-period Simple Moving Average (50 SMA) at 97.8922 and approaching the 100-period Simple Moving Average (100 SMA) at 98.0463, but still below the 200-period Simple Moving Average (200 SMA) at 98.2784. This moving average alignment suggests that the US Dollar Index is in a short-term consolidation phase, lacking a clear direction. The proximity of the 50 and 100 SMAs forms a potential support area, while the 200 SMA presents strong upward resistance. If the US Dollar Index can break through the 200 SMA, further upside potential is possible, targeting the 99.00 round number. Conversely, a break below the 50 SMA could lead to a test of short-term support near 97.50.
The MACD indicator (26, 12, 9) further reveals the momentum of the US dollar index. The current DIFF value is -0.0604, the DEA is -0.1055, and the MACD-histogram is positive at 0.0878, indicating that the fast line (DIFF) has crossed above the slow line (DEA), forming a golden cross signal and suggesting a bullish bias in the short term. However, the small absolute values of the DIFF and DEA, and the limited range of the MACD-histogram, suggest that bullish momentum has not yet been fully unleashed and the market may remain in a wait-and-see mode. Combining the moving averages and MACD signals, the US dollar index is likely to fluctuate between 97.89 and 98.27 in the short term, with further guidance from PPI and CPI data needed to determine the direction of a breakout.
From a broader perspective, the positive correlation between the US dollar index and US Treasury yields remains strong. With the 10-year US Treasury yield stabilizing near 4.09%, if PPI data or subsequent CPI data push the yield above 4.12%, the US dollar index could be boosted, potentially testing the 200-day moving average resistance. Conversely, if the yield falls back to 4.07% or lower, the dollar could face downward pressure. Furthermore, some traders point out that the US dollar index's fluctuations may be influenced by safe-haven currencies such as the Japanese yen. In particular, recent comments from Bank of Japan officials regarding interest rate hikes could push up the yen, indirectly suppressing the USD/JPY exchange rate and thus influencing the performance of the US dollar index.
Looking ahead to the week ahead, the direction of the US dollar index will largely depend on the PPI data on September 10th and the CPI data on September 11th. If both the PPI and core CPI figures meet expectations (PPI at 3.3% year-on-year and core PPI at 3.5% year-on-year, a mild CPI reading), the market is likely to continue pricing in a 25 basis point rate cut from the Federal Reserve, and the US dollar index will likely fluctuate narrowly between 97.89 and 98.27, struggling to break through the 200-day moving average resistance in the short term. However, if the core CPI shows higher-than-expected services inflation, or if the PPI data suggests further rising inflationary pressures, the market may reassess the Fed's pace of rate cuts, and the US dollar index could potentially break through 98.27 and test the 99.00 mark. Conversely, if the data falls significantly short of expectations, coupled with a weak job market, expectations of a 50 basis point rate cut could intensify, and the US dollar index could fall towards the 97.50 support level.
From a technical perspective, the MACD golden cross signal provides short-term support for the US dollar, but the momentum is insufficient to drive a strong breakout. Traders should closely monitor whether the US dollar index can hold above the 100 SMA (98.0463) and whether US Treasury yields break through 4.12% or fall back to 4.07%. Furthermore, risk aversion fueled by tariff rhetoric is likely to intensify in November. Combined with the Supreme Court trial process, the US dollar is likely to remain resilient due to safe-haven demand. Some believe that uncertainty surrounding the Federal Reserve's policy may cause the US dollar to remain volatile at a high level in the short term, but its long-term trajectory will depend on the balance between inflation and employment data.
The US dollar index currently faces an uncertain trajectory, spurred by a complex mix of fundamentals and technicals. PPI and CPI data will be key drivers of short-term trends, while fluctuations in US Treasury yields and evolving expectations of a Fed rate cut will continue to influence market sentiment. Traders should remain vigilant, closely monitoring data releases and market reactions, while also monitoring key moving averages and MACD signals to identify potential breakouts.
Meanwhile, market expectations for a rate cut at the Federal Reserve's September meeting continue to build, compounded by risk aversion fueled by tariff rhetoric. The dollar's performance presents a complex picture. Weak employment data has further fueled speculation about Fed policy, while technical indicators suggest the dollar index is facing a directional dilemma near key moving averages. The following analysis will examine the current dollar trend and future trends from both fundamental and technical perspectives.
Fundamental analysis: Inflation, employment and policy expectations are intertwined
The short-term performance of the US dollar is closely tied to fluctuations in US Treasury yields. On September 10th, the market observed a bearish flattening of the US Treasury yield curve, with 10-year and 30-year Treasury yields rising 2 and 3 basis points, respectively. This reflects investors' cautious stance regarding the upcoming PPI data and the $39 billion 10-year Treasury auction. Leading analysts indicate that the market expects the PPI to maintain its year-on-year growth rate of 3.3% in August, while the core PPI (excluding food and energy) is expected to decline slightly from 3.7% to 3.5%, both showing a month-on-month increase of 0.3%. While this figure represents a cooling from the 0.9% increase in July, it still indicates persistent inflationary pressures, particularly in the services sector, where sticky inflation may become a key variable. If the core PPI or tomorrow's CPI data indicate rising services sector inflation, the market may reprice US Treasury yields, driving further dollar strength.
Weak employment data adds uncertainty to the US dollar's trajectory. Preliminary data released by the US Bureau of Labor Statistics (BLS) on Tuesday showed a downward revision of 911,000 non-farm payrolls through March 2025, implying an average monthly loss of approximately 76,000 jobs. This significant revision confirms Federal Reserve official Christopher Waller's warning of a slowing labor market. Waller stated in July that private sector hiring was "close to stalling," a finding further vindicated by the release of the August employment report. The market generally expects the Federal Reserve to cut interest rates at next week's FOMC meeting, with both a 25 basis point and a 50 basis point probability under discussion. The possibility of a 50 basis point cut has increased due to the weak employment data. If PPI and CPI data do not show a significant deterioration in inflation, the Fed may favor a gradual approach to rate cuts, which would limit the dollar's upside. However, if inflation data exceeds expectations, the dollar could find support due to rising expectations of a rate hike.
Furthermore, the impact of tariff rhetoric on market sentiment cannot be ignored. The Supreme Court (SCOTUS) has accepted the White House's request to expedite its review of the legality of the relevant tariff policies, with oral arguments expected in November. This development could prolong the risk-averse sentiment seen in October and November, pushing up US Treasury yields and indirectly supporting the US dollar. Reputable analysts believe the impact of tariffs will likely be felt in the second half of 2025, primarily through commodity inflation reflected in the PPI and CPI data. However, the stickiness of service sector inflation will be a key focus for the Federal Reserve. If data indicates persistent inflationary pressures, market expectations for Fed policy could shift from easing to a wait-and-see approach, potentially leading to high volatility in the US dollar index.
Technical analysis: the game between key moving averages and MACD signals
From a technical perspective, the performance of the US Dollar Index on the 4-hour chart warrants attention. The latest quotes indicate that the US Dollar Index has fluctuated slightly during the day, currently trading above the 50-period Simple Moving Average (50 SMA) at 97.8922 and approaching the 100-period Simple Moving Average (100 SMA) at 98.0463, but still below the 200-period Simple Moving Average (200 SMA) at 98.2784. This moving average alignment suggests that the US Dollar Index is in a short-term consolidation phase, lacking a clear direction. The proximity of the 50 and 100 SMAs forms a potential support area, while the 200 SMA presents strong upward resistance. If the US Dollar Index can break through the 200 SMA, further upside potential is possible, targeting the 99.00 round number. Conversely, a break below the 50 SMA could lead to a test of short-term support near 97.50.
The MACD indicator (26, 12, 9) further reveals the momentum of the US dollar index. The current DIFF value is -0.0604, the DEA is -0.1055, and the MACD-histogram is positive at 0.0878, indicating that the fast line (DIFF) has crossed above the slow line (DEA), forming a golden cross signal and suggesting a bullish bias in the short term. However, the small absolute values of the DIFF and DEA, and the limited range of the MACD-histogram, suggest that bullish momentum has not yet been fully unleashed and the market may remain in a wait-and-see mode. Combining the moving averages and MACD signals, the US dollar index is likely to fluctuate between 97.89 and 98.27 in the short term, with further guidance from PPI and CPI data needed to determine the direction of a breakout.
From a broader perspective, the positive correlation between the US dollar index and US Treasury yields remains strong. With the 10-year US Treasury yield stabilizing near 4.09%, if PPI data or subsequent CPI data push the yield above 4.12%, the US dollar index could be boosted, potentially testing the 200-day moving average resistance. Conversely, if the yield falls back to 4.07% or lower, the dollar could face downward pressure. Furthermore, some traders point out that the US dollar index's fluctuations may be influenced by safe-haven currencies such as the Japanese yen. In particular, recent comments from Bank of Japan officials regarding interest rate hikes could push up the yen, indirectly suppressing the USD/JPY exchange rate and thus influencing the performance of the US dollar index.
Future Trend Outlook
Looking ahead to the week ahead, the direction of the US dollar index will largely depend on the PPI data on September 10th and the CPI data on September 11th. If both the PPI and core CPI figures meet expectations (PPI at 3.3% year-on-year and core PPI at 3.5% year-on-year, a mild CPI reading), the market is likely to continue pricing in a 25 basis point rate cut from the Federal Reserve, and the US dollar index will likely fluctuate narrowly between 97.89 and 98.27, struggling to break through the 200-day moving average resistance in the short term. However, if the core CPI shows higher-than-expected services inflation, or if the PPI data suggests further rising inflationary pressures, the market may reassess the Fed's pace of rate cuts, and the US dollar index could potentially break through 98.27 and test the 99.00 mark. Conversely, if the data falls significantly short of expectations, coupled with a weak job market, expectations of a 50 basis point rate cut could intensify, and the US dollar index could fall towards the 97.50 support level.
From a technical perspective, the MACD golden cross signal provides short-term support for the US dollar, but the momentum is insufficient to drive a strong breakout. Traders should closely monitor whether the US dollar index can hold above the 100 SMA (98.0463) and whether US Treasury yields break through 4.12% or fall back to 4.07%. Furthermore, risk aversion fueled by tariff rhetoric is likely to intensify in November. Combined with the Supreme Court trial process, the US dollar is likely to remain resilient due to safe-haven demand. Some believe that uncertainty surrounding the Federal Reserve's policy may cause the US dollar to remain volatile at a high level in the short term, but its long-term trajectory will depend on the balance between inflation and employment data.
The US dollar index currently faces an uncertain trajectory, spurred by a complex mix of fundamentals and technicals. PPI and CPI data will be key drivers of short-term trends, while fluctuations in US Treasury yields and evolving expectations of a Fed rate cut will continue to influence market sentiment. Traders should remain vigilant, closely monitoring data releases and market reactions, while also monitoring key moving averages and MACD signals to identify potential breakouts.
- Risk Warning and Disclaimer
- The market involves risk, and trading may not be suitable for all investors. This article is for reference only and does not constitute personal investment advice, nor does it take into account certain users’ specific investment objectives, financial situation, or other needs. Any investment decisions made based on this information are at your own risk.