As expectations of interest rate cuts rise, why is gold still suppressed by risk appetite?
2025-09-11 17:37:12
On Thursday (September 11) in the European session, spot gold came under pressure after rebounding the previous day, fluctuating around $3,620 and giving up some of its gains; it was restrained by the strengthening equity market and the mild rebound of the US dollar, but considering that the expectations of interest rate cuts before the Federal Reserve's interest rate meeting next week continued to heat up and geopolitical uncertainties remained high, the downward elasticity of gold prices was limited, and the overall price was still in a rebalancing stage after a high-level pullback.

In the US market, both major indices hit record highs on Wednesday, with risk appetite continuing into Thursday. Japan's Nikkei 225 index rose over 1% during Asian trading, setting another new record. This cross-market combination of risk appetite and risk aversion is exerting short-term pressure on non-interest-bearing assets. Meanwhile, the US dollar rebounded modestly after falling to near its lowest level since July 28, but the extent of the rebound was limited.
Regarding macroeconomic data, the U.S. Bureau of Labor Statistics released Wednesday that the Producer Price Index for August fell to 2.6% year-on-year, down from 3.3% in the previous month. The core PPI, excluding food and energy, rose to 2.8% year-on-year, compared to 3.7% previously. Amidst lingering tariff concerns and rising import prices, producer price pressures have declined rather than increased. This, coupled with signs of a weakening labor market, reinforces the market's interpretation of slowing demand. Regarding interest rate expectations, the market generally believes there's still a small probability of an extraordinary rate cut at the Federal Reserve's September 17th meeting, with expectations of three 25 basis point rate cuts this year. This expectation is suppressing the dollar's rebound and providing some cushion for gold.
Regarding geopolitical and policy uncertainties, recent developments in Eastern Europe have seen further turbulence. Poland shot down a Russian drone on Wednesday that had entered its airspace after a mission from western Ukraine, objectively raising risk premiums. Furthermore, regarding trade policy, the United States has already raised tariffs on some Indian goods to 50%. While these measures primarily represent negotiation and policy signals, they are sufficient to create volatility in sentiment, providing some passive support for gold.
The 4-hour chart shows that the current uptrend, which began in late August, reached a high of 3674.34 near the upper Bollinger Band in early September before entering a period of consolidation. Currently, the price is trading near the middle Bollinger Band at 3624.24, with the upper Bollinger Band at 3684.73 and the lower Bollinger Band at 3563.74. The band is converging gently, with the upper band flattening, the middle band slowly rising, and the lower band rising—a typical structural pattern of a retracement.
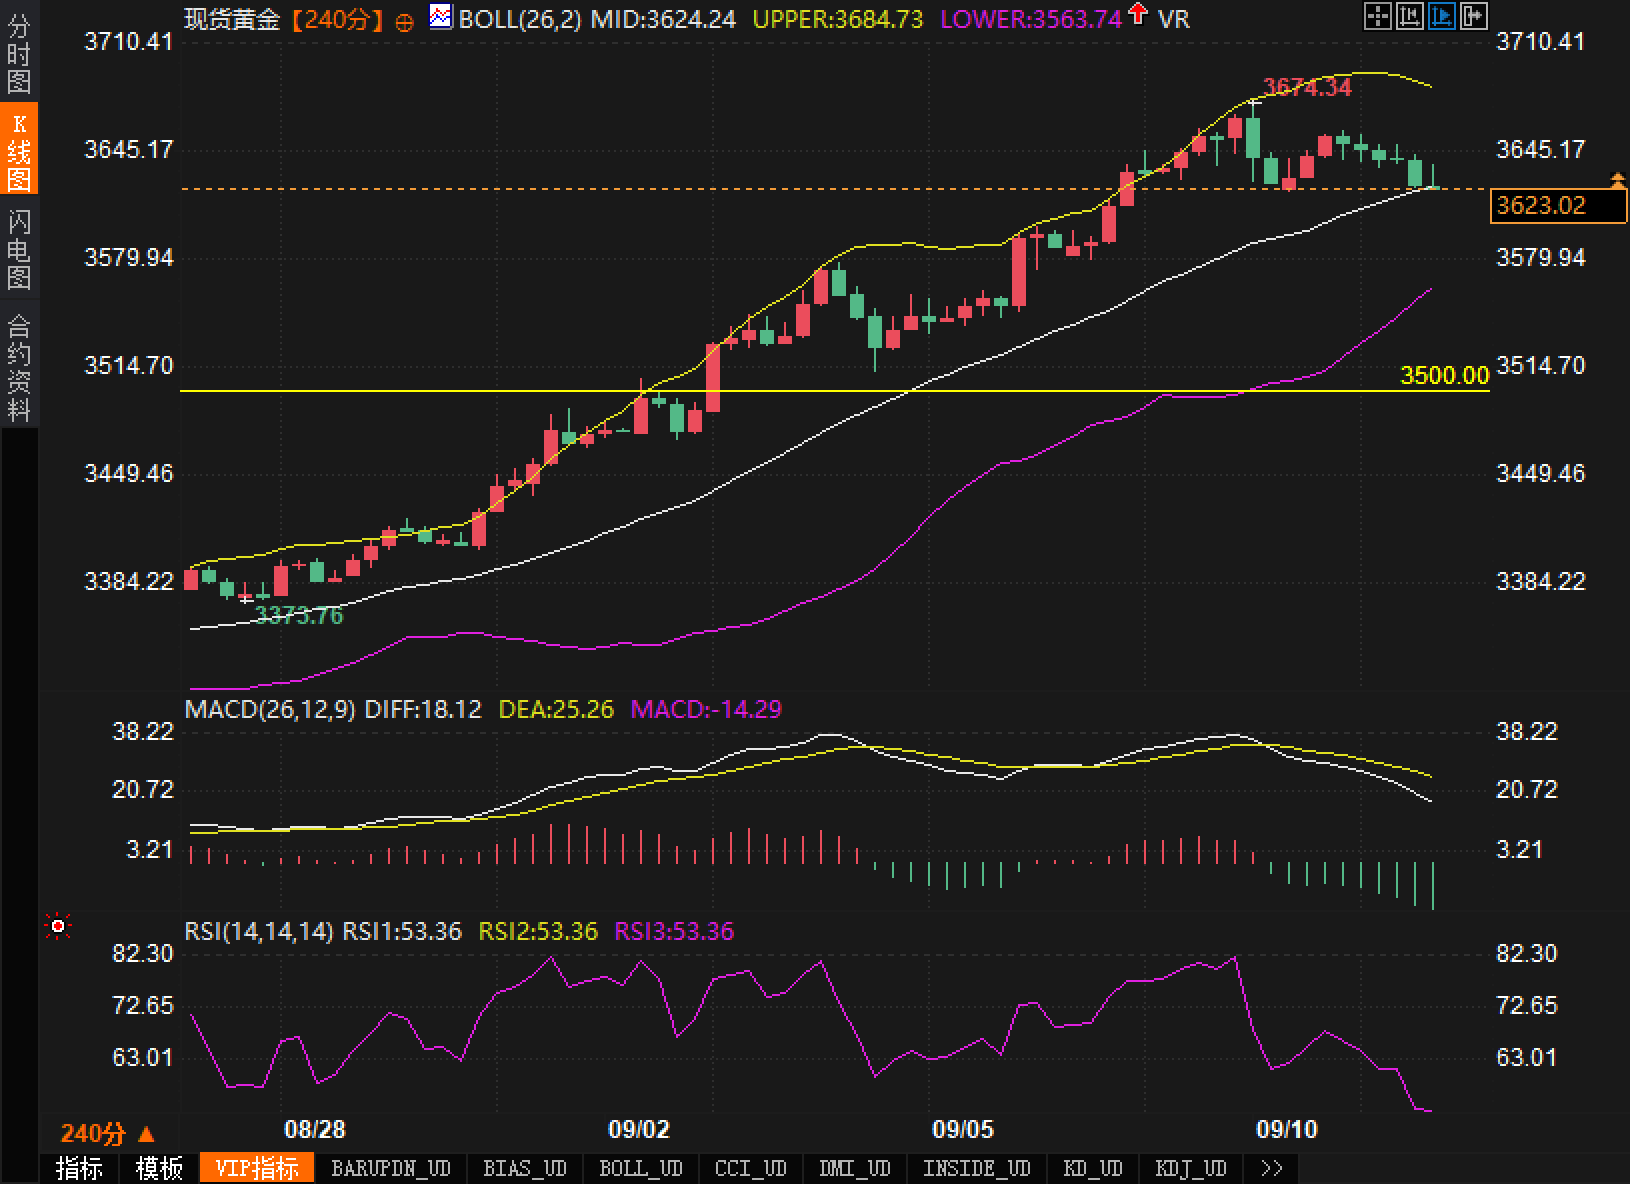
In terms of momentum indicators, the DIFF of MACD is 18.12 and the DEA is 25.26. The DIFF is below the DEA and the bar value is -14.29 and gradually increases, indicating that the short-term momentum has entered the "divergence-correction" stage. The price is easily pulled back by the moving average and repeatedly retests the middle track. The relative strength index RSI (14) fell back to 53.36, significantly cooling down from the earlier overbought zone, indicating a neutral to weak trend. At the static level, the 3500.00 position superimposed on the lower Bollinger band 3563.74 forms the first support band; above, pay attention to the dense trading area near 3650 and the stage high of 3674.34. If it breaks above, it will point to the upper Bollinger band 3684.73. Comprehensive judgment: the trend has not broken, the rhythm has slowed down, and the short-term trend is mainly repeated near the middle track.
The main contradiction in current sentiment is between "easing expectations supporting gold" and "risk appetite suppressing safe-haven demand." The equity market's continuous record highs are unleashing incremental risk appetite, while options and quantitative funds tend to chase trends, weakening gold's safe-haven premium. However, the repricing of interest rate expectations has reduced risk-free returns, and the decline in real interest rates has provided an anchor for gold valuations.
Meanwhile, the sudden military incident in Eastern Europe has re-emerged "tail risk" on traders' agendas, prompting a continued tendency to allocate on dips during pullbacks. Notably, recent on-market volatility readings have shown a downward trend, and short-term pullbacks have not triggered panic selling, indicating a relatively stable structure. From a cross-sector perspective, volatility in interest rates is higher than in the commodity sector, suggesting that CTAs and trend-setting funds are more likely to increase their directional exposure only after interest rates are finalized. Overall, sentiment has shifted from a "one-sided pursuit of gains" to a "cautious optimism amidst high volatility," with the impact on prices favoring range-bound volatility convergence rather than a trend reversal.
Short-term (data-driven): The primary catalyst for the next 24-72 hours will be US inflation readings. If inflation continues to weaken and expectations of rate cuts strengthen, gold prices are expected to retest 3650 and 3674.34. A further break above this level will warrant scrutiny of 3684.73. If inflation unexpectedly rebounds and the US dollar strengthens, prices could retreat toward the 3563.74-3500.00 support zone. At this point, watch for gains and losses at the middle band at 3624.24 and the strength of the lower band. Regardless of direction, indicator converging may still precede trend development. Be wary of the common pattern of "false breakouts followed by pullback confirmation." In a declining volatility environment, prices are more likely to follow a zigzag path of "slow climb, sharp pullback, and renewed convergence."
Fundamentals:
In the US market, both major indices hit record highs on Wednesday, with risk appetite continuing into Thursday. Japan's Nikkei 225 index rose over 1% during Asian trading, setting another new record. This cross-market combination of risk appetite and risk aversion is exerting short-term pressure on non-interest-bearing assets. Meanwhile, the US dollar rebounded modestly after falling to near its lowest level since July 28, but the extent of the rebound was limited.
Regarding macroeconomic data, the U.S. Bureau of Labor Statistics released Wednesday that the Producer Price Index for August fell to 2.6% year-on-year, down from 3.3% in the previous month. The core PPI, excluding food and energy, rose to 2.8% year-on-year, compared to 3.7% previously. Amidst lingering tariff concerns and rising import prices, producer price pressures have declined rather than increased. This, coupled with signs of a weakening labor market, reinforces the market's interpretation of slowing demand. Regarding interest rate expectations, the market generally believes there's still a small probability of an extraordinary rate cut at the Federal Reserve's September 17th meeting, with expectations of three 25 basis point rate cuts this year. This expectation is suppressing the dollar's rebound and providing some cushion for gold.
Regarding geopolitical and policy uncertainties, recent developments in Eastern Europe have seen further turbulence. Poland shot down a Russian drone on Wednesday that had entered its airspace after a mission from western Ukraine, objectively raising risk premiums. Furthermore, regarding trade policy, the United States has already raised tariffs on some Indian goods to 50%. While these measures primarily represent negotiation and policy signals, they are sufficient to create volatility in sentiment, providing some passive support for gold.
Technical aspects:
The 4-hour chart shows that the current uptrend, which began in late August, reached a high of 3674.34 near the upper Bollinger Band in early September before entering a period of consolidation. Currently, the price is trading near the middle Bollinger Band at 3624.24, with the upper Bollinger Band at 3684.73 and the lower Bollinger Band at 3563.74. The band is converging gently, with the upper band flattening, the middle band slowly rising, and the lower band rising—a typical structural pattern of a retracement.
In terms of momentum indicators, the DIFF of MACD is 18.12 and the DEA is 25.26. The DIFF is below the DEA and the bar value is -14.29 and gradually increases, indicating that the short-term momentum has entered the "divergence-correction" stage. The price is easily pulled back by the moving average and repeatedly retests the middle track. The relative strength index RSI (14) fell back to 53.36, significantly cooling down from the earlier overbought zone, indicating a neutral to weak trend. At the static level, the 3500.00 position superimposed on the lower Bollinger band 3563.74 forms the first support band; above, pay attention to the dense trading area near 3650 and the stage high of 3674.34. If it breaks above, it will point to the upper Bollinger band 3684.73. Comprehensive judgment: the trend has not broken, the rhythm has slowed down, and the short-term trend is mainly repeated near the middle track.
Market sentiment observation:
The main contradiction in current sentiment is between "easing expectations supporting gold" and "risk appetite suppressing safe-haven demand." The equity market's continuous record highs are unleashing incremental risk appetite, while options and quantitative funds tend to chase trends, weakening gold's safe-haven premium. However, the repricing of interest rate expectations has reduced risk-free returns, and the decline in real interest rates has provided an anchor for gold valuations.
Meanwhile, the sudden military incident in Eastern Europe has re-emerged "tail risk" on traders' agendas, prompting a continued tendency to allocate on dips during pullbacks. Notably, recent on-market volatility readings have shown a downward trend, and short-term pullbacks have not triggered panic selling, indicating a relatively stable structure. From a cross-sector perspective, volatility in interest rates is higher than in the commodity sector, suggesting that CTAs and trend-setting funds are more likely to increase their directional exposure only after interest rates are finalized. Overall, sentiment has shifted from a "one-sided pursuit of gains" to a "cautious optimism amidst high volatility," with the impact on prices favoring range-bound volatility convergence rather than a trend reversal.
Market outlook:
Short-term (data-driven): The primary catalyst for the next 24-72 hours will be US inflation readings. If inflation continues to weaken and expectations of rate cuts strengthen, gold prices are expected to retest 3650 and 3674.34. A further break above this level will warrant scrutiny of 3684.73. If inflation unexpectedly rebounds and the US dollar strengthens, prices could retreat toward the 3563.74-3500.00 support zone. At this point, watch for gains and losses at the middle band at 3624.24 and the strength of the lower band. Regardless of direction, indicator converging may still precede trend development. Be wary of the common pattern of "false breakouts followed by pullback confirmation." In a declining volatility environment, prices are more likely to follow a zigzag path of "slow climb, sharp pullback, and renewed convergence."
- Risk Warning and Disclaimer
- The market involves risk, and trading may not be suitable for all investors. This article is for reference only and does not constitute personal investment advice, nor does it take into account certain users’ specific investment objectives, financial situation, or other needs. Any investment decisions made based on this information are at your own risk.