Ratings downgrades and US rate cut expectations: The EUR/USD dilemma
2025-09-15 17:39:07
During the European session on Monday (September 15th), the EUR/USD exchange rate briefly retreated to 1.1720 before rebounding to trade sideways around 1.1740, with volatility suppressed. Following Fitch's recent downgrade of France's sovereign rating to A+, the euro has begun trading cautiously. Meanwhile, US dollar volatility has been limited, with market attention focused on Wednesday's Federal Reserve interest rate decision and its dot plot. The combined impact of political uncertainty and a widening fiscal deficit in France continues to unfold, but at the current pace, the Fed's interest rate outlook and forward guidance remain the key variables determining the short-term direction of the dollar and euro.
Fitch recently downgraded France's sovereign rating to A+, citing political instability (Emmanuel Macron appointed Sébastien Le Cornu as his third prime minister last week) and the prospect of a widening deficit. The ratings news had limited immediate impact on the euro, as the market focused on the Fed's results and the forward guidance from Chairman Powell's press conference. While the market generally priced in a baseline scenario of a 25 basis point rate cut, the path of interest rates and the tone of communication are more crucial. If the dot plot and language become more dovish, the dollar could continue to decline. However, if a "slower and longer" tightening path of rate cuts is signaled, the dollar could find temporary support.
Today's macroeconomic calendar is quiet: ECB President Christine Lagarde will attend a roundtable forum in Paris, and Schnabel will deliver a speech in Luxembourg. Their comments on France's fiscal policy and the eurozone's inflation path may provide marginal clues for the euro. In the US, with the Fed's "quiet period" and a lack of key data, directional bets on the dollar are becoming cautious, with trading volume and volatility converging.
Last week, the US inflation mix was relatively benign: CPI growth was modest, and PPI figures were weaker than expected. This, coupled with a sharp drop in September consumer confidence to a four-month low from the University of Michigan, suggests that higher commodity prices due to tariffs are dampening consumer spending and weighing on growth momentum. Overall, this data set paves the way for an interest rate cut and a more dovish monetary policy stance this week. In the European bond market, France's 10-year yield rose by about 5 basis points to above 3.5%, while the 30-year yield briefly reached 4.33%. While lower than the highs that triggered a significant pullback in the euro in early September, it still provided a headwind for euro bulls. Equity and commodity markets are also in a wait-and-see mode, with no significant shift in risk appetite.
On the daily chart, the upper Bollinger Band is at 1.1763, the middle band is at 1.1678, and the lower band is at 1.1592. The latest candlestick body is located between the middle and upper bands, near 1.1740, indicating a consolidation upward trend close to the upper band. The Bollinger Band width has recently widened slightly after a period of convergence, suggesting the accumulation of event-driven volatility risks. Since its rise from the low of 1.1391, the price has experienced a pullback and rebound pattern around 1.1573. Currently, it is repeatedly testing the upper band at 1.1763. The previous significant swing high is at 1.1779. The previous high of 1.1789 is also in sight, forming a dense resistance area.
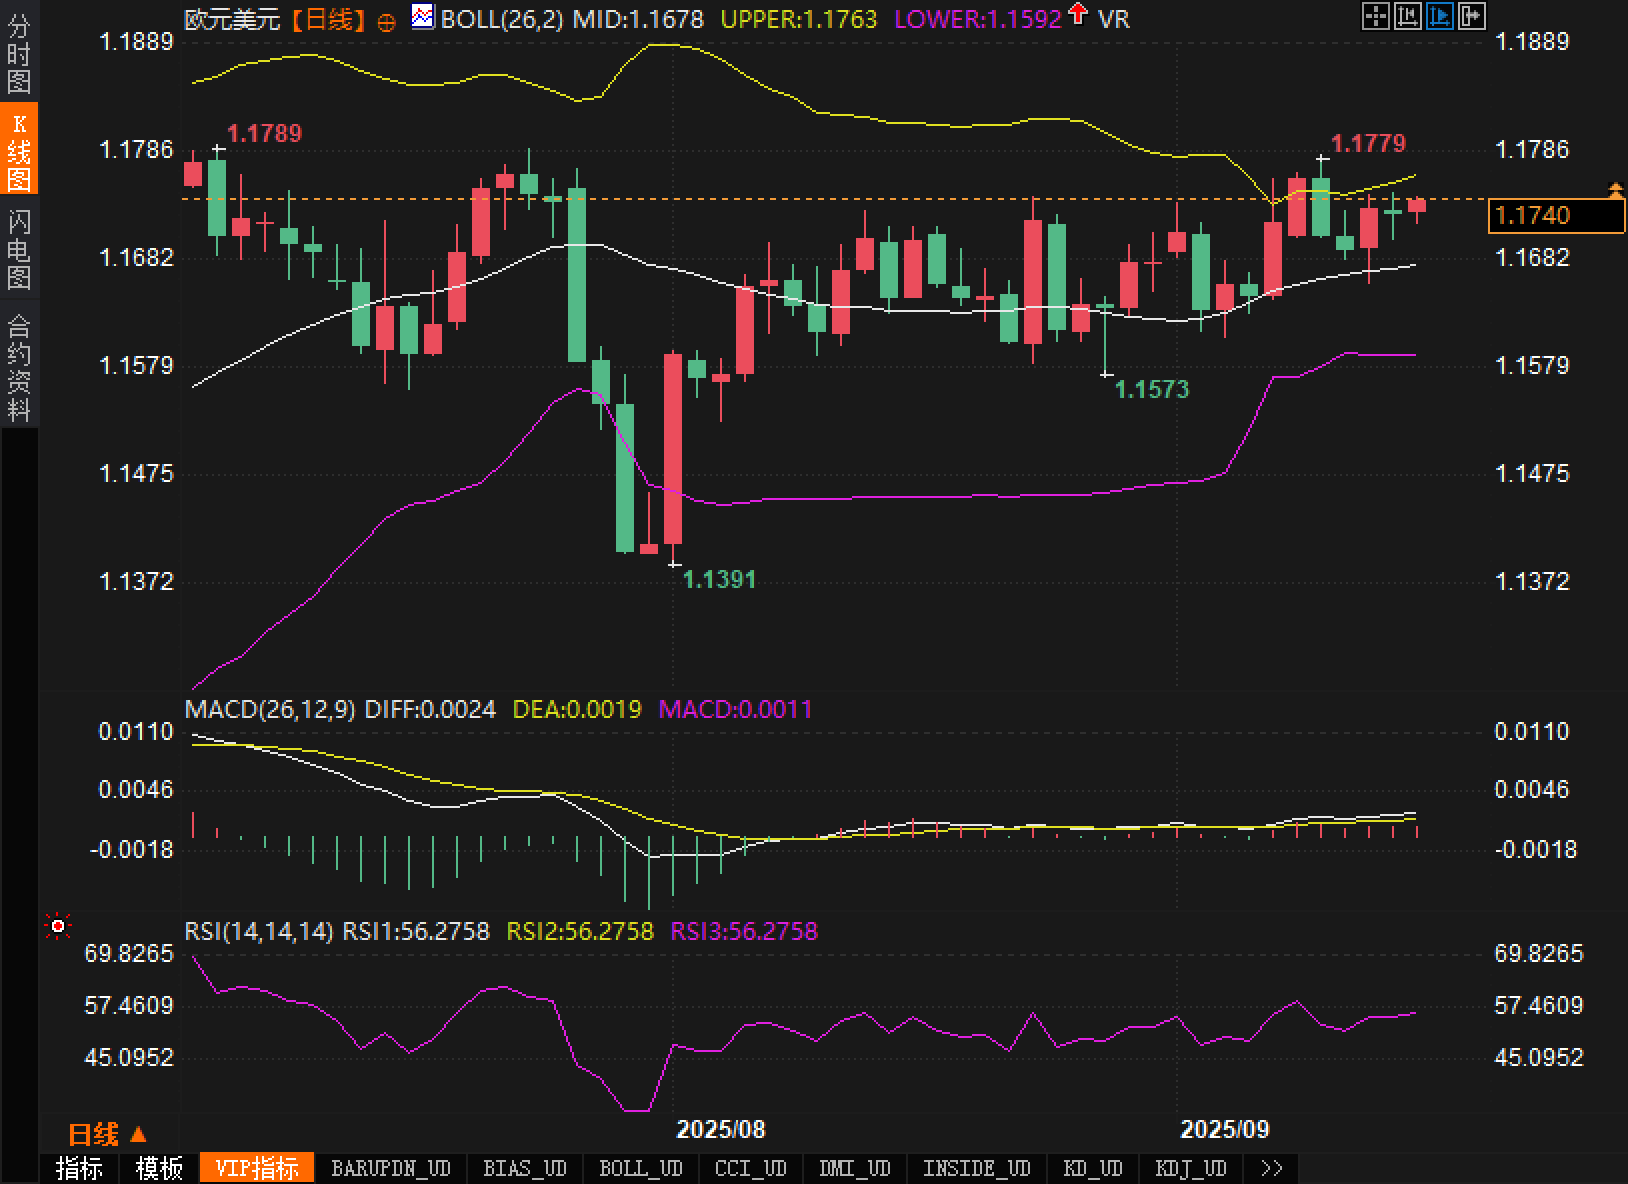
Regarding MACD, DIFF = 0.0024 and DEA = 0.0019, both above the zero axis and with DIFF slightly higher than DEA. The histogram is slightly positive, indicating a "mildly bullish but not amplified" momentum, indicating that an upward trend still requires catalyst. RSI (14) is approximately 56.28, in the neutral to strong range and not yet overbought.
Overall analysis: Upward resistance is expected to focus on 1.1763 (upper Bollinger band) – 1.1779 – 1.1789. A successful breakout above this level with strong volume could signal an extension of the daily trend, signaling a strengthening trend along the outer edge of the upper band. Conversely, repeated resistance near the upper band, accompanied by a long upper shadow, could trigger a false breakout and a pullback to test the middle band at 1.1678. Support is expected at 1.1700 and around 1.1680, with 1.1592 (lower Bollinger band) as the next support level. Without strong volume and momentum, the market will likely continue to trade within the upper range of the box, and event risk could be a trigger for price action.
Scenario 1 (Dovish): If the Fed cuts interest rates by 25 basis points as planned this week, accompanied by a downward shift in the dot plot and a press conference emphasizing the lagged impact of growth and financial conditions on the real economy, the US dollar may come under temporary pressure. A significant breakout above 1.1763/1.1779 on strong volume and a sustained hold above this level could trigger an upside extension to 1.1800-1.1830 (corresponding to a widening Bollinger Band and a larger MACD histogram). Strategically, this signals a technical upward trend, signaling a "trend extension." However, caution remains to be taken regarding a pullback after a dense upper shadow near the upper edge, potentially retesting the middle band.
Scenario 2 (hawkish correction): If the pace and outlook of rate cuts are cautious, or the dot plot's downward revision of the number of rate cuts next year exceeds market expectations, the US dollar will stabilize, and the probability of the euro rising and falling in the 1.1760-1.1780 area will increase; the exchange rate may retrace to test the 1.1700 integer and the nearby support of 1.1680. If it falls below and the Bollinger Bands close again, the daily chart will return to the horizontal channel; further declines will focus on 1.1678 (Bollinger middle band) and 1.1592 (lower band).
Fundamentals:
Fitch recently downgraded France's sovereign rating to A+, citing political instability (Emmanuel Macron appointed Sébastien Le Cornu as his third prime minister last week) and the prospect of a widening deficit. The ratings news had limited immediate impact on the euro, as the market focused on the Fed's results and the forward guidance from Chairman Powell's press conference. While the market generally priced in a baseline scenario of a 25 basis point rate cut, the path of interest rates and the tone of communication are more crucial. If the dot plot and language become more dovish, the dollar could continue to decline. However, if a "slower and longer" tightening path of rate cuts is signaled, the dollar could find temporary support.
Today's macroeconomic calendar is quiet: ECB President Christine Lagarde will attend a roundtable forum in Paris, and Schnabel will deliver a speech in Luxembourg. Their comments on France's fiscal policy and the eurozone's inflation path may provide marginal clues for the euro. In the US, with the Fed's "quiet period" and a lack of key data, directional bets on the dollar are becoming cautious, with trading volume and volatility converging.
Last week, the US inflation mix was relatively benign: CPI growth was modest, and PPI figures were weaker than expected. This, coupled with a sharp drop in September consumer confidence to a four-month low from the University of Michigan, suggests that higher commodity prices due to tariffs are dampening consumer spending and weighing on growth momentum. Overall, this data set paves the way for an interest rate cut and a more dovish monetary policy stance this week. In the European bond market, France's 10-year yield rose by about 5 basis points to above 3.5%, while the 30-year yield briefly reached 4.33%. While lower than the highs that triggered a significant pullback in the euro in early September, it still provided a headwind for euro bulls. Equity and commodity markets are also in a wait-and-see mode, with no significant shift in risk appetite.
Technical aspects:
On the daily chart, the upper Bollinger Band is at 1.1763, the middle band is at 1.1678, and the lower band is at 1.1592. The latest candlestick body is located between the middle and upper bands, near 1.1740, indicating a consolidation upward trend close to the upper band. The Bollinger Band width has recently widened slightly after a period of convergence, suggesting the accumulation of event-driven volatility risks. Since its rise from the low of 1.1391, the price has experienced a pullback and rebound pattern around 1.1573. Currently, it is repeatedly testing the upper band at 1.1763. The previous significant swing high is at 1.1779. The previous high of 1.1789 is also in sight, forming a dense resistance area.
Regarding MACD, DIFF = 0.0024 and DEA = 0.0019, both above the zero axis and with DIFF slightly higher than DEA. The histogram is slightly positive, indicating a "mildly bullish but not amplified" momentum, indicating that an upward trend still requires catalyst. RSI (14) is approximately 56.28, in the neutral to strong range and not yet overbought.
Overall analysis: Upward resistance is expected to focus on 1.1763 (upper Bollinger band) – 1.1779 – 1.1789. A successful breakout above this level with strong volume could signal an extension of the daily trend, signaling a strengthening trend along the outer edge of the upper band. Conversely, repeated resistance near the upper band, accompanied by a long upper shadow, could trigger a false breakout and a pullback to test the middle band at 1.1678. Support is expected at 1.1700 and around 1.1680, with 1.1592 (lower Bollinger band) as the next support level. Without strong volume and momentum, the market will likely continue to trade within the upper range of the box, and event risk could be a trigger for price action.
Market outlook:
Scenario 1 (Dovish): If the Fed cuts interest rates by 25 basis points as planned this week, accompanied by a downward shift in the dot plot and a press conference emphasizing the lagged impact of growth and financial conditions on the real economy, the US dollar may come under temporary pressure. A significant breakout above 1.1763/1.1779 on strong volume and a sustained hold above this level could trigger an upside extension to 1.1800-1.1830 (corresponding to a widening Bollinger Band and a larger MACD histogram). Strategically, this signals a technical upward trend, signaling a "trend extension." However, caution remains to be taken regarding a pullback after a dense upper shadow near the upper edge, potentially retesting the middle band.
Scenario 2 (hawkish correction): If the pace and outlook of rate cuts are cautious, or the dot plot's downward revision of the number of rate cuts next year exceeds market expectations, the US dollar will stabilize, and the probability of the euro rising and falling in the 1.1760-1.1780 area will increase; the exchange rate may retrace to test the 1.1700 integer and the nearby support of 1.1680. If it falls below and the Bollinger Bands close again, the daily chart will return to the horizontal channel; further declines will focus on 1.1678 (Bollinger middle band) and 1.1592 (lower band).
- Risk Warning and Disclaimer
- The market involves risk, and trading may not be suitable for all investors. This article is for reference only and does not constitute personal investment advice, nor does it take into account certain users’ specific investment objectives, financial situation, or other needs. Any investment decisions made based on this information are at your own risk.