There is a sudden vacuum in U.S. Treasury bond liquidity, and the U.S. dollar is approaching the critical point of 97.24, which may usher in a drastic change!
2025-09-15 21:40:58
The US Dollar Index continued its late-day correction on Monday (September 15th), currently hovering around 97.36, a slight decline of 0.24% on the day. This movement is not isolated, but is closely intertwined with tightening liquidity in the US Treasury market. The short-term end of the US Treasury yield curve has shifted sharply upward, with the overnight secured funding rate (GC) jumping to a bid price of 4.60%, up 12 basis points from last Friday. This capital outflow directly amplifies the dollar's safe-haven properties, but also limits upward momentum as the market prices in the Federal Reserve's policy shift. Overall, the liquidity disturbance in US Treasury bonds is becoming an immediate anchor for the US dollar's performance, with bulls and bears vying within a key technical range in the short term, warranting traders' high vigilance.
The US Treasury market showed signs of liquidity strain at the start of this week, primarily due to a combination of cash accumulation during the September tax season and liquidity outflows from the settlement of $78 billion in Treasury auctions. These auctions involved 3-, 10-, and 30-year bonds, and the settlement effect directly drained money from the market, putting pressure on overnight collateral funding conditions. The GC rate thus broke through the upper limit of the 4.25% to 4.5% policy rate corridor by 10 basis points, with the 10-day average starting level locked at 4.435%. This level could become a downward target if further capital inflows return. This upward trend in short-term interest rates is not a sudden policy signal, but rather the result of seasonality and auction rhythms. However, it has quietly increased the opportunity cost of holding US dollar assets, providing immediate support for the US dollar index.
From a broader perspective, this liquidity disruption is amplifying volatility in US Treasury yields. Recent RP operation data shows that total demand reached $26.9 billion on September 11th, falling to $17.33 billion the following day. Participant allocations remained stable at around $3.58 billion, reflecting the market's increased reliance on liquidity injections. The Federal Reserve's RP facility will open at 1:30 PM (ET) with an interest rate of 4.50%, capped at $500 billion. If overnight interest rates remain high, utilization is expected to rise significantly. However, the current interest rate is 35 basis points higher than the RP rate, which may dampen demand and further highlight the structural tightening of the liquidity situation. Traders from prominent institutions believe that this phenomenon resembles a "liquidity vacuum," which will increase the dollar's appeal in the short term, especially amidst cooling global risk appetite.
The shift in the maturity structure of US Treasury bonds is also noteworthy. While the 10-year premium has receded in tandem with the current coupon settlement, the 20-year premium rose to 55 basis points before Thursday's auction. The 5-year premium moved up 20 basis points through the GC channel. This suggests that demand for short- and medium-term bonds is facing challenges, with capital outflows being transmitted from the auction side to the entire yield curve. The GCF bid and ask rates were 4.61%, while collateralized financing was in the 4.67% to 4.66% range. The GC spread over the overnight interbank reserve requirement rate remained at 0.20%, and the spread over the RP rate remained at 0.21%. While these subtle shifts in spreads are minor, they are amplifying the sensitivity of the US Treasury market. Once the tax season effect subsides, the yield curve may reshape, indirectly impacting the dollar's safe-haven premium.
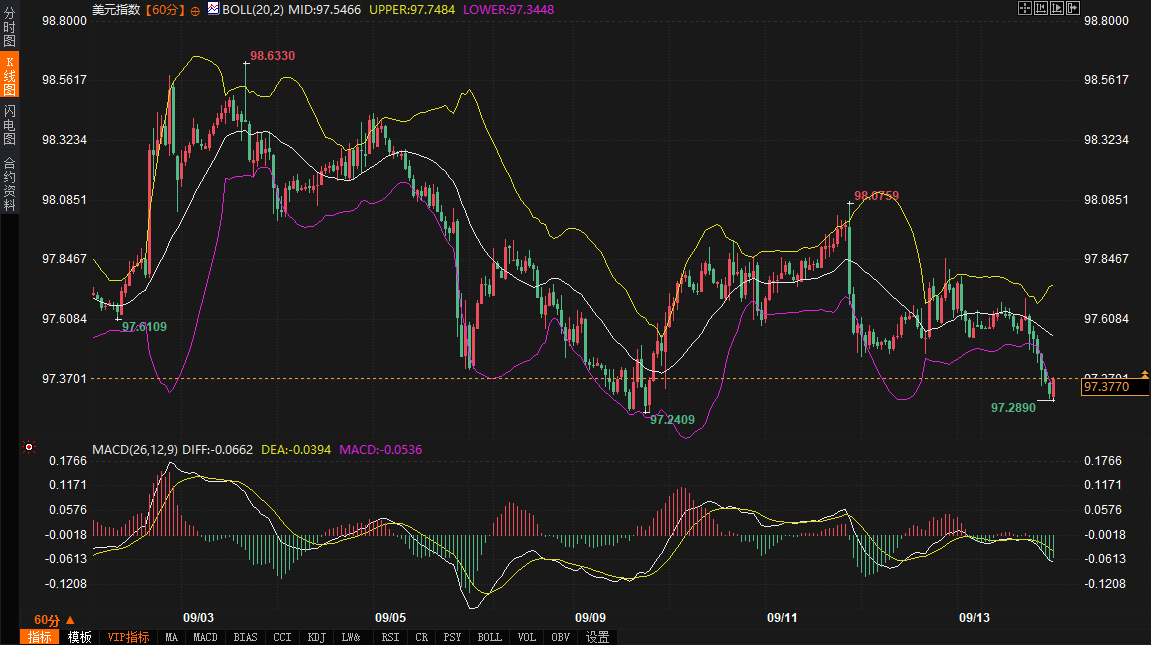
Turning to the 60-minute chart of the US Dollar Index, price action is now converging below the middle Bollinger Band at 97.5459 and has effectively broken below the previous key low of 97.6109. This breakout suggests that previous support has turned into resistance, significantly weakening short-term bullish momentum. The current price is approaching the lower Bollinger Band at 97.3388, suggesting a buffer zone remains, but bearish momentum is becoming increasingly evident. The MACD indicator further supports this view, with the DIFF line at -0.0679 lying below the DEA line at -0.0397, with both lines hovering below zero. The histogram is predominantly green, indicating no clear signs of exhaustion in bearish momentum. Absent external catalysts, the price is likely to fluctuate and correct within the 97.2409 to 97.6109 range. Below 97.2409, a historical low, offers strong rebound potential.
This technical correction didn't occur in a vacuum; it was highly synchronized with the US Treasury funding situation. The jump in the GC rate directly raised US dollar funding costs, strengthening the index's short-term support. However, the market's 100% pricing in a 25 basis point FOMC rate cut has created an upward ceiling. The 0x3 OIS was at 3.953%, 0.6 basis points lower than the previous day and 43.7 basis points below the 10-day SOFR average of 4.39%. This implies a 100% probability of a 25 basis point downward shift in the interest rate corridor, and even a 75% probability of a 50 basis point shift. Federal Funds futures also priced in a 100% probability of a September rate cut, with the one-month repo rate at 4.23%, the two-month at 4.27%, and the three-month at 4.28%. The divergence in these indicators is amplifying the linkage between US Treasury bonds and the US dollar.
Feedback from the trading community on [the site] confirms this divergence. Several veteran forex traders noted that capital outflows are squeezing dollar long positions, but the unexpected rise in short-term interest rates has provided a buffer, preventing a deeper correction. One institutional user emphasized that the mixed opening of SOFR futures—red and green contracts rose by 1 basis point, while white and blue contracts remained flat—reflects the market's cautious optimism regarding a policy shift. This community consensus echoes the technical chart: increased trading volume within the support range will be key to predicting a reversal. If price effectively reclaims the middle Bollinger Band at 97.5459, the bearish signal may be mitigated; otherwise, the probability of a test of 97.3388 increases. Today's auctions of 3-month and 6-month Treasury bills (non-competitive bidding at 11:00 AM, competitive bidding at 11:30 AM) will also introduce new variables, and the immediate reaction of US Treasury yields may directly spill over into the US dollar market.
Fundamentally, immediate pressure in the U.S. Treasury market is reshaping the dollar's trajectory through policy expectations and external risks. While the dual squeeze of tax season and auctions is a short-term phenomenon, combined with long position liquidation ahead of Wednesday's FOMC meeting, it has pushed overnight funding to the upper limit of the corridor. This liquidity tightening, similar to a "prepayment" effect, supports dollar strength in the short term, but also anchors it in the pricing of rate cuts. Analysts from leading institutions believe that the current trading range of the federal funds market, between 4.31% and 4.33%, combined with the 100% rate cut signal from SOFR futures, is creating an "expectation gap trap"—the contrast between rising immediate funding costs and future policy easing is exacerbating the jagged fluctuations in U.S. Treasury yields.
Geopolitical factors are also quietly brewing. The ongoing uncertainty surrounding the Russia-Ukraine situation has reinforced the dollar's safe-haven status, while recent tariff talk has sparked brief market concerns, fueling risk aversion in US Treasuries. While these external factors aren't dominant, they do exacerbate the sensitivity of the funding landscape. Recent institutional discussions have focused on this issue, with one bond trader stating, "The $78 billion outflow from auction settlements is a devastating blow, hitting the bottom line of liquidity, but the $500 billion cap on RP instruments provides a safety net." Another viewpoint points to the 55 basis point increase in the 20-year premium, signaling weak medium- to long-term demand, which could indirectly undermine dollar bullish sentiment. Overall, these fundamental clues underscore the growing role of US Treasuries as a barometer of the dollar, with the volatile upward trend in short-term interest rates becoming a key metric for assessing the dollar's resilience.
Looking ahead to the remainder of this week, the US Dollar Index is likely to continue its volatile pattern between 97.2409 and 97.6109. The cushioning effect of rising short-term interest rates will limit any significant correction, but the locked-in expectation of a rate cut by the FOMC will dampen momentum for a breakout above the upper band. If US Treasury liquidity stabilizes after the RP operation, prices may find a bottom near the lower Bollinger Band at 97.3388. If bearish momentum fails to form a golden cross below the MACD zero axis, the test of the 97.2409 support level will intensify. Conversely, the fading tax season effect and a mild auction outcome could trigger a retest of the middle band at 97.5459, triggering a corrective rebound.
Longer-term, the short-term steepening of the US Treasury yield curve will continue to feed through to the US dollar. The 43.7 basis point spread of the 0x3 OIS suggests a path-dependent downward shift in the policy corridor. If capital inflows accelerate after the September rate cut, the US dollar index will gradually show a downward tilt, potentially targeting a point below the previous low. However, marginal changes in the Russia-Ukraine situation and the risk-off aftermath of tariff rhetoric could still inject uncertainty, pushing the index back and forth within a range. It is important to monitor the synergy between trading volume and indicators. If bearish dominance persists, a weaker trend in the short term may dominate the market until fundamentals provide a new anchor.
Tightening of U.S. Treasury bond liquidity: an invisible force supporting the dollar in the short term
The US Treasury market showed signs of liquidity strain at the start of this week, primarily due to a combination of cash accumulation during the September tax season and liquidity outflows from the settlement of $78 billion in Treasury auctions. These auctions involved 3-, 10-, and 30-year bonds, and the settlement effect directly drained money from the market, putting pressure on overnight collateral funding conditions. The GC rate thus broke through the upper limit of the 4.25% to 4.5% policy rate corridor by 10 basis points, with the 10-day average starting level locked at 4.435%. This level could become a downward target if further capital inflows return. This upward trend in short-term interest rates is not a sudden policy signal, but rather the result of seasonality and auction rhythms. However, it has quietly increased the opportunity cost of holding US dollar assets, providing immediate support for the US dollar index.
From a broader perspective, this liquidity disruption is amplifying volatility in US Treasury yields. Recent RP operation data shows that total demand reached $26.9 billion on September 11th, falling to $17.33 billion the following day. Participant allocations remained stable at around $3.58 billion, reflecting the market's increased reliance on liquidity injections. The Federal Reserve's RP facility will open at 1:30 PM (ET) with an interest rate of 4.50%, capped at $500 billion. If overnight interest rates remain high, utilization is expected to rise significantly. However, the current interest rate is 35 basis points higher than the RP rate, which may dampen demand and further highlight the structural tightening of the liquidity situation. Traders from prominent institutions believe that this phenomenon resembles a "liquidity vacuum," which will increase the dollar's appeal in the short term, especially amidst cooling global risk appetite.
The shift in the maturity structure of US Treasury bonds is also noteworthy. While the 10-year premium has receded in tandem with the current coupon settlement, the 20-year premium rose to 55 basis points before Thursday's auction. The 5-year premium moved up 20 basis points through the GC channel. This suggests that demand for short- and medium-term bonds is facing challenges, with capital outflows being transmitted from the auction side to the entire yield curve. The GCF bid and ask rates were 4.61%, while collateralized financing was in the 4.67% to 4.66% range. The GC spread over the overnight interbank reserve requirement rate remained at 0.20%, and the spread over the RP rate remained at 0.21%. While these subtle shifts in spreads are minor, they are amplifying the sensitivity of the US Treasury market. Once the tax season effect subsides, the yield curve may reshape, indirectly impacting the dollar's safe-haven premium.
Technical pullback: The range game of the US dollar index and the linkage of US bonds
Turning to the 60-minute chart of the US Dollar Index, price action is now converging below the middle Bollinger Band at 97.5459 and has effectively broken below the previous key low of 97.6109. This breakout suggests that previous support has turned into resistance, significantly weakening short-term bullish momentum. The current price is approaching the lower Bollinger Band at 97.3388, suggesting a buffer zone remains, but bearish momentum is becoming increasingly evident. The MACD indicator further supports this view, with the DIFF line at -0.0679 lying below the DEA line at -0.0397, with both lines hovering below zero. The histogram is predominantly green, indicating no clear signs of exhaustion in bearish momentum. Absent external catalysts, the price is likely to fluctuate and correct within the 97.2409 to 97.6109 range. Below 97.2409, a historical low, offers strong rebound potential.
This technical correction didn't occur in a vacuum; it was highly synchronized with the US Treasury funding situation. The jump in the GC rate directly raised US dollar funding costs, strengthening the index's short-term support. However, the market's 100% pricing in a 25 basis point FOMC rate cut has created an upward ceiling. The 0x3 OIS was at 3.953%, 0.6 basis points lower than the previous day and 43.7 basis points below the 10-day SOFR average of 4.39%. This implies a 100% probability of a 25 basis point downward shift in the interest rate corridor, and even a 75% probability of a 50 basis point shift. Federal Funds futures also priced in a 100% probability of a September rate cut, with the one-month repo rate at 4.23%, the two-month at 4.27%, and the three-month at 4.28%. The divergence in these indicators is amplifying the linkage between US Treasury bonds and the US dollar.
Feedback from the trading community on [the site] confirms this divergence. Several veteran forex traders noted that capital outflows are squeezing dollar long positions, but the unexpected rise in short-term interest rates has provided a buffer, preventing a deeper correction. One institutional user emphasized that the mixed opening of SOFR futures—red and green contracts rose by 1 basis point, while white and blue contracts remained flat—reflects the market's cautious optimism regarding a policy shift. This community consensus echoes the technical chart: increased trading volume within the support range will be key to predicting a reversal. If price effectively reclaims the middle Bollinger Band at 97.5459, the bearish signal may be mitigated; otherwise, the probability of a test of 97.3388 increases. Today's auctions of 3-month and 6-month Treasury bills (non-competitive bidding at 11:00 AM, competitive bidding at 11:30 AM) will also introduce new variables, and the immediate reaction of US Treasury yields may directly spill over into the US dollar market.
Policy Expectations and Geopolitical Disturbance: The Transmission Path of US Debt Pressure
Fundamentally, immediate pressure in the U.S. Treasury market is reshaping the dollar's trajectory through policy expectations and external risks. While the dual squeeze of tax season and auctions is a short-term phenomenon, combined with long position liquidation ahead of Wednesday's FOMC meeting, it has pushed overnight funding to the upper limit of the corridor. This liquidity tightening, similar to a "prepayment" effect, supports dollar strength in the short term, but also anchors it in the pricing of rate cuts. Analysts from leading institutions believe that the current trading range of the federal funds market, between 4.31% and 4.33%, combined with the 100% rate cut signal from SOFR futures, is creating an "expectation gap trap"—the contrast between rising immediate funding costs and future policy easing is exacerbating the jagged fluctuations in U.S. Treasury yields.
Geopolitical factors are also quietly brewing. The ongoing uncertainty surrounding the Russia-Ukraine situation has reinforced the dollar's safe-haven status, while recent tariff talk has sparked brief market concerns, fueling risk aversion in US Treasuries. While these external factors aren't dominant, they do exacerbate the sensitivity of the funding landscape. Recent institutional discussions have focused on this issue, with one bond trader stating, "The $78 billion outflow from auction settlements is a devastating blow, hitting the bottom line of liquidity, but the $500 billion cap on RP instruments provides a safety net." Another viewpoint points to the 55 basis point increase in the 20-year premium, signaling weak medium- to long-term demand, which could indirectly undermine dollar bullish sentiment. Overall, these fundamental clues underscore the growing role of US Treasuries as a barometer of the dollar, with the volatile upward trend in short-term interest rates becoming a key metric for assessing the dollar's resilience.
Outlook: Range-bound and downward trend in the US dollar index
Looking ahead to the remainder of this week, the US Dollar Index is likely to continue its volatile pattern between 97.2409 and 97.6109. The cushioning effect of rising short-term interest rates will limit any significant correction, but the locked-in expectation of a rate cut by the FOMC will dampen momentum for a breakout above the upper band. If US Treasury liquidity stabilizes after the RP operation, prices may find a bottom near the lower Bollinger Band at 97.3388. If bearish momentum fails to form a golden cross below the MACD zero axis, the test of the 97.2409 support level will intensify. Conversely, the fading tax season effect and a mild auction outcome could trigger a retest of the middle band at 97.5459, triggering a corrective rebound.
Longer-term, the short-term steepening of the US Treasury yield curve will continue to feed through to the US dollar. The 43.7 basis point spread of the 0x3 OIS suggests a path-dependent downward shift in the policy corridor. If capital inflows accelerate after the September rate cut, the US dollar index will gradually show a downward tilt, potentially targeting a point below the previous low. However, marginal changes in the Russia-Ukraine situation and the risk-off aftermath of tariff rhetoric could still inject uncertainty, pushing the index back and forth within a range. It is important to monitor the synergy between trading volume and indicators. If bearish dominance persists, a weaker trend in the short term may dominate the market until fundamentals provide a new anchor.
- Risk Warning and Disclaimer
- The market involves risk, and trading may not be suitable for all investors. This article is for reference only and does not constitute personal investment advice, nor does it take into account certain users’ specific investment objectives, financial situation, or other needs. Any investment decisions made based on this information are at your own risk.