US crude oil fluctuates and consolidates, is the technical outlook bullish? Waiting for the Fed's decision signal!
2025-09-17 14:20:38
West Texas Intermediate (WTI) crude oil prices struggled to sustain the strong rebound of the past three trading days, fluctuating around $64.50 during the Asian and European trading hours on Wednesday (September 17). However, oil prices remain bullish, supported by the risk of geopolitical supply disruptions.

The market awaits the outcome of the Federal Reserve's September 16-17 interest rate meeting, with a 25 basis point rate cut widely expected. This will undoubtedly significantly impact the price trends of dollar-pegged commodities like crude oil. Furthermore, a rate cut could lower financing costs, thereby boosting fuel demand.
Data from the American Petroleum Institute (API) showed that U.S. crude oil inventories fell by 3.42 million barrels in the week ending September 12, gasoline inventories fell by 691,000 barrels, and distillate oil inventories increased by 1.91 million barrels.
"Heightened concerns about Russian supply disruptions are supporting oil prices," said Tony Sycamore, market analyst at IG.
Technical Analysis
From a technical perspective, Tuesday's breakout of a short-term rising channel extending from the multi-month lows hit earlier this month is seen as a key signal to trigger a bullish rally. In addition, positive oscillators on the hourly and daily charts show that the path of least resistance for crude oil prices remains to the upside, providing a basis for buying on dips.
A break below $64.00 (also the turning point of the rising channel resistance) could trigger a technical sell-off, pushing oil prices down to the next key support level near $63.50. A continued decline would indicate that the rebound momentum is exhausted and oil prices may fall further below $63.00.
The downtrend may continue to the mid-way support level of $62.20, and may eventually break below the $62.00 mark to test the lower track of the aforementioned channel (in the $61.80-61.75 range).
On the other hand, the $64.70 level (the two-week high reached on Tuesday) will constitute near-term resistance, above which oil prices are expected to re-test the psychological $65.00 level. Sustained buying will pave the way for a move towards the $65.50-65.60 resistance area, a break of which would confirm the constructive outlook and trigger another round of short covering.
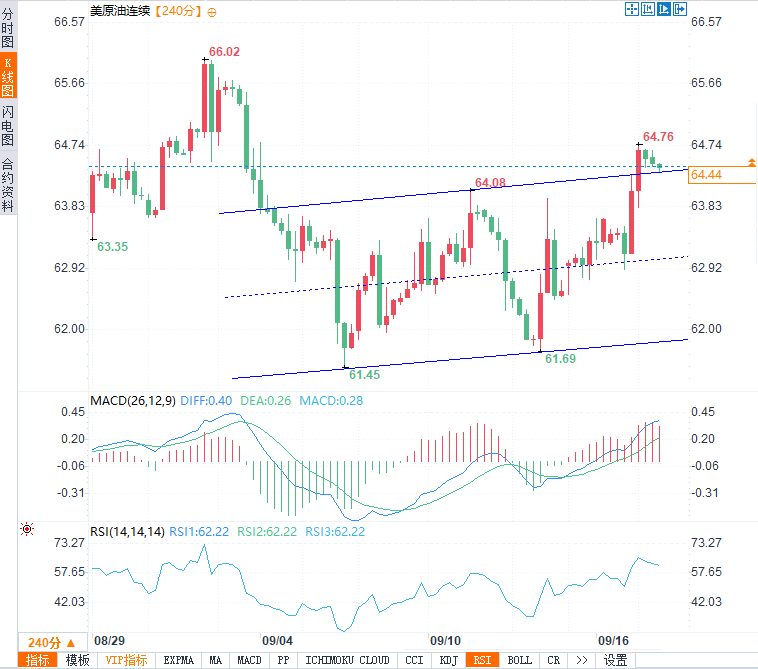
(US crude oil 4-hour chart, source: Yihuitong)
At 14:20 Beijing time, U.S. crude oil continued to trade at $64.35 per barrel.
The market awaits the outcome of the Federal Reserve's September 16-17 interest rate meeting, with a 25 basis point rate cut widely expected. This will undoubtedly significantly impact the price trends of dollar-pegged commodities like crude oil. Furthermore, a rate cut could lower financing costs, thereby boosting fuel demand.
Data from the American Petroleum Institute (API) showed that U.S. crude oil inventories fell by 3.42 million barrels in the week ending September 12, gasoline inventories fell by 691,000 barrels, and distillate oil inventories increased by 1.91 million barrels.
"Heightened concerns about Russian supply disruptions are supporting oil prices," said Tony Sycamore, market analyst at IG.
Technical Analysis
From a technical perspective, Tuesday's breakout of a short-term rising channel extending from the multi-month lows hit earlier this month is seen as a key signal to trigger a bullish rally. In addition, positive oscillators on the hourly and daily charts show that the path of least resistance for crude oil prices remains to the upside, providing a basis for buying on dips.
A break below $64.00 (also the turning point of the rising channel resistance) could trigger a technical sell-off, pushing oil prices down to the next key support level near $63.50. A continued decline would indicate that the rebound momentum is exhausted and oil prices may fall further below $63.00.
The downtrend may continue to the mid-way support level of $62.20, and may eventually break below the $62.00 mark to test the lower track of the aforementioned channel (in the $61.80-61.75 range).
On the other hand, the $64.70 level (the two-week high reached on Tuesday) will constitute near-term resistance, above which oil prices are expected to re-test the psychological $65.00 level. Sustained buying will pave the way for a move towards the $65.50-65.60 resistance area, a break of which would confirm the constructive outlook and trigger another round of short covering.
(US crude oil 4-hour chart, source: Yihuitong)
At 14:20 Beijing time, U.S. crude oil continued to trade at $64.35 per barrel.
- Risk Warning and Disclaimer
- The market involves risk, and trading may not be suitable for all investors. This article is for reference only and does not constitute personal investment advice, nor does it take into account certain users’ specific investment objectives, financial situation, or other needs. Any investment decisions made based on this information are at your own risk.