Is the eye of the US debt storm forming? The "judgment day" of the US dollar and gold is approaching!
2025-09-18 21:06:05
This article will start from the dynamics of the U.S. Treasury market, analyze the short-term trends of the U.S. dollar and gold, and look forward to future trends by combining fundamentals and technical aspects.

U.S. Treasury market: The core impact of liquidity and interest rate cut expectations
The U.S. Treasury market serves as a transmission hub for both the dollar and gold prices, and its dynamics have a profound impact on both. On September 18, the Federal Reserve confirmed a further 25-50 basis point interest rate cut this year, adjusting the federal funds target rate range to 4.25%-4.5% or 4.0%-4.25%. Market expectations (as indicated by the CME FedWatch tool) suggest further rate cuts of 50-75 basis points are possible at the November and December FOMC meetings, potentially bringing the final rate to 3.75%-4.0%. Meanwhile, the Fed is maintaining its pace of quantitative tightening (QT), reducing Treasury holdings by $60 billion and mortgage-backed securities by $35 billion per month. This policy continues to put pressure on liquidity in the Treasury market.
Short-term U.S. Treasury bonds and liquidity volatility <br/>With the quarter-end (September 30th) approaching, market liquidity demand is increasing. The Federal Reserve's Standing Repurchase Facility (SRF) usage is expected to surge to $30-50 billion to address pressures from bank regulatory reporting and tax payments. The balance of the Overnight Reverse Repurchase Facility (ON RRP) is likely to increase from the current $100-110 billion to $120-150 billion, reflecting the need for institutions to "park" their positions in volatile markets. This could impact the yield on short-term U.S. Treasury bonds (such as the 3-month T-bill) from 4.5% to 4.7%-4.8% as institutions increase their holdings of U.S. Treasury bonds as collateral. Technically, the yields on 2-year and 5-year Treasury bonds (currently 4.18% and 4.08%) may rise briefly due to pressure in the repo market, but the Fed's SRF operations will limit any rapid rise in yields.
Long-Term US Treasuries and Macroeconomic Expectations <br/>Long-term US Treasuries (e.g., 10-year bonds, yielding approximately 3.7%-4.0%) are primarily driven by expectations of rate cuts and inflation data. If the FOMC signals a slowdown in QT at its October or December meeting (e.g., reducing the monthly US Treasury balance sheet reduction by $60 billion), the 10-year yield could fall to 3.5%-3.8% as the market anticipates easing supply pressures on US Treasuries. The current core PCE inflation rate (2.5%-2.7%) is close to the 2% target, strengthening expectations of a soft landing, providing room for rate cuts and potential QT adjustments. However, if inflation data exceeds expectations or geopolitical risks (such as the Russia-Ukraine situation) intensify, risk aversion could boost demand for long-term US Treasuries and push down yields.
Market Sentiment and Transmission Mechanisms <br/>The US Treasury market's core role lies in its dual transmission of US dollar financing costs and safe-haven demand. Tightening liquidity at the end of the quarter could push up the SOFR (currently at a 10-day average of 4.41%), indirectly supporting US dollar demand. Meanwhile, expectations of rate cuts weaken the appeal of US dollar assets, boosting gold's safe-haven value. Traders should closely monitor the New York Fed's SRF/ON RRP data on September 30th and the FOMC meeting minutes in early October to capture further impacts of policy signals on US Treasury yields.
US Dollar Index: Waiting for a breakthrough in direction amidst fluctuations
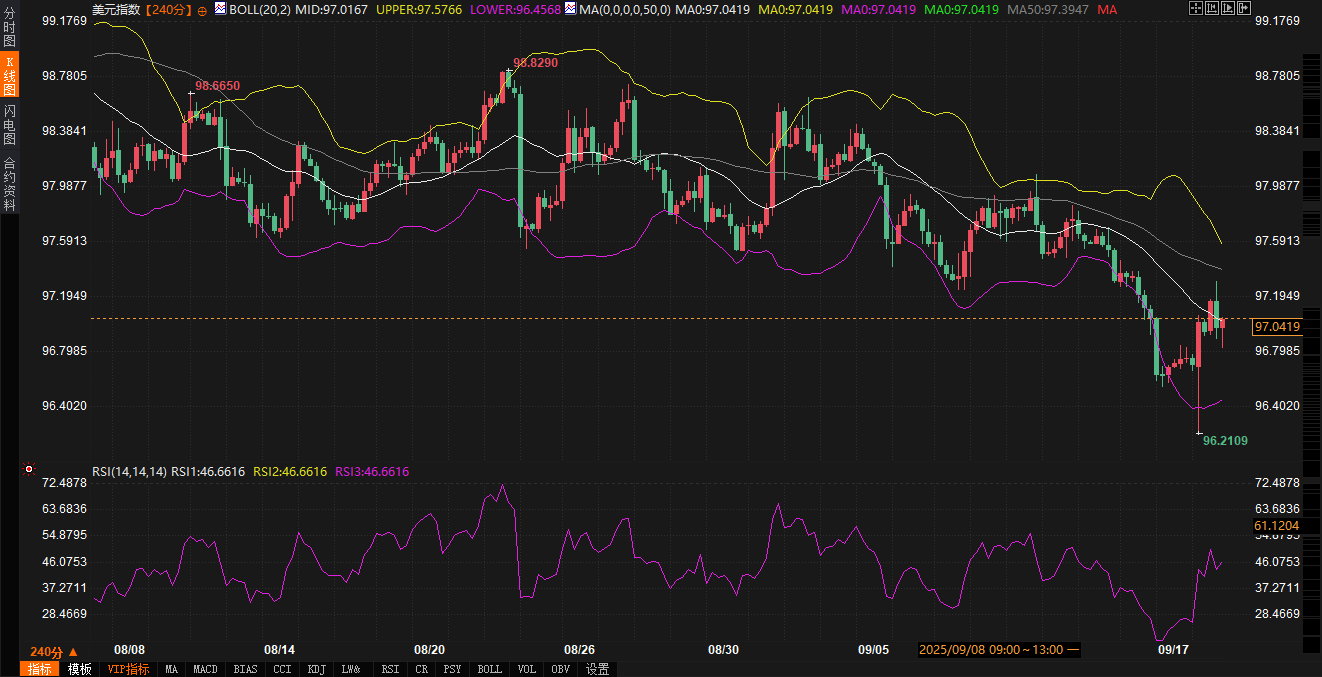
The US Dollar Index (DXY) is currently trading at 97.0360, near the middle Bollinger Band (97.0163), with a slight increase of 0.03% on the day. Technically, the dollar is forming a range-bound trading range between 96.40 and 97.60, with the Bollinger Band width narrowing to 1.12 points. The RSI indicator is at 46.81, in a neutral to weak range, indicating a temporary balance between bulls and bears. The moving average system is showing a bearish trend (MA10 > MA50), but the short-term moving average (MA06/08/09 approximately 97.0419) coincides with the current price, indicating insufficient momentum. A directional breakout requires fundamental catalysts.

Fundamental Drivers <br/>The path of the Federal Reserve's rate cuts is a key variable in the dollar's trajectory. The 25 basis point rate cut in September has been partially priced in, and the market anticipates another 25-50 basis point cut in November or December. If the pace of rate cuts meets expectations (cumulatively 50-75 basis points), the US dollar index could fall to the 98-100 range. If it exceeds expectations (e.g., by more than 75 basis points), it could fall below 98, testing the secondary support level of 95.80. End-of-quarter liquidity tightening (e.g., a surge in SRF usage) could temporarily push up dollar funding costs, supporting a test of 102-103 for the DXY by the end of September. However, synchronized easing by global central banks (e.g., in the Eurozone and Japan) is likely to maintain the dollar's relative appeal and limit its downside.
Technical Analysis: The US Dollar Index has been repeatedly testing the 96.40-97.60 range since March, with key resistance at 97.60 (the upper Bollinger Band) and support at 96.40 (the lower Bollinger Band plus the previous low) forming a consolidation framework. A breakout would require the RSI to cross 50 or the Bollinger Bands to open. The current contraction in volatility suggests a directional breakout is imminent. Traders should monitor the dollar's correlation with the euro and pound during the European trading session, as well as the market's reaction to economic data (such as non-farm payrolls and CPI) during the New York trading session. Some traders suggest that if the dollar fails to break through 97.60, short-term volatility may persist, with a high risk of false breakouts.
The Link Between the US Dollar and US Treasuries <br/> Fluctuations in US Treasury yields directly influence the US dollar. Rising short-term US Treasury yields may boost demand for the dollar, especially during quarter-end liquidity constraints; falling long-term US Treasury yields (if QT slows) may weaken the dollar's appeal. Traders should be wary of the interaction between rate cut expectations and risk aversion. For example, tariff rhetoric or escalating tensions between Russia and Ukraine could boost safe-haven demand, temporarily supporting the US dollar.
Spot gold: The game between risk aversion and bond market transmission
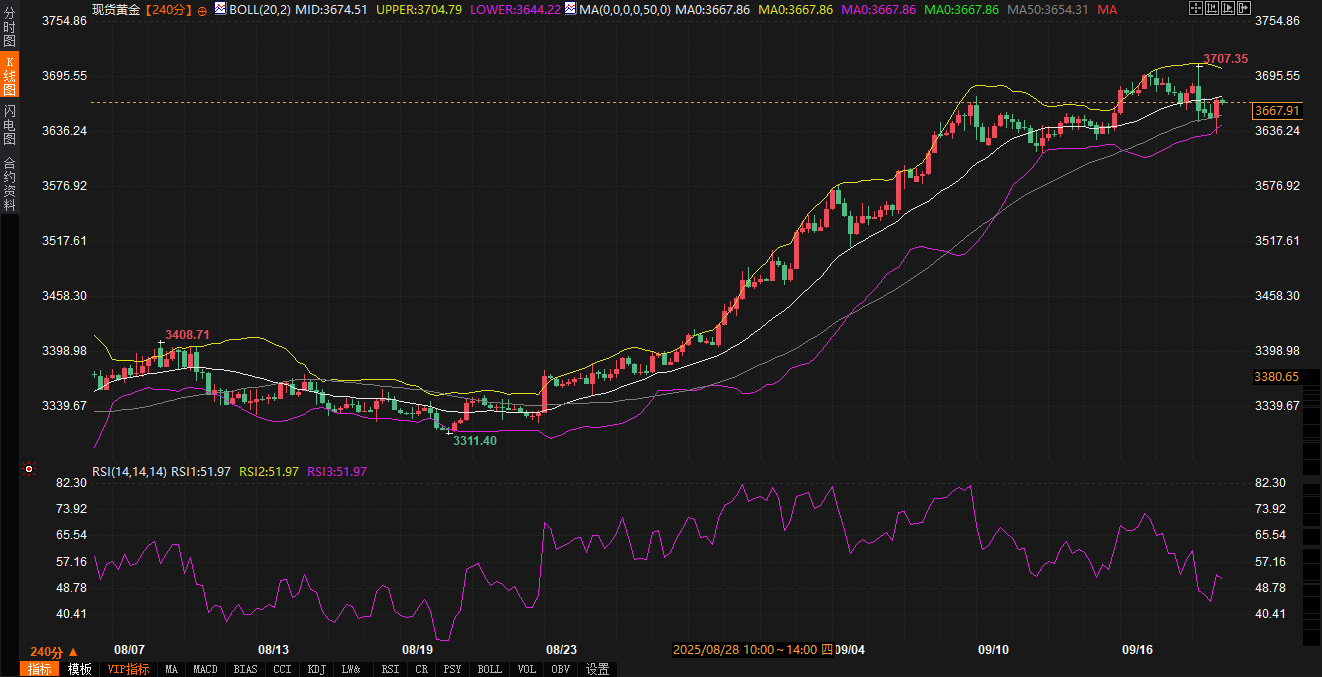
Spot gold is trading at $3,667.59 per ounce, up 0.21% on the day. The price is trading close to the middle Bollinger Band (3,674.50), but below the upper Bollinger Band (3,704.79). The 50-period moving average (3,654.31) provides short-term support, while the RSI at 51.86 is in neutral territory, indicating a strong wait-and-see market sentiment. The technical structure shows a "converging moving averages and narrowing Bollinger Bands" pattern, with prices fluctuating between 3,644 and 3,704, with a band width of approximately $60, suggesting an imminent directional breakout.

Fundamental Drivers: Safe-haven Effect Transmitted from the Bond Market <br/>Gold prices are driven by both real interest rate expectations and safe-haven demand. The Federal Reserve's rate cuts have lowered real US Treasury yields (10-year real yields are around 1.5%-1.8%), increasing gold's appeal. A further 50-75 basis point cut this year could push real yields further down to 1.2%-1.5%, supporting gold prices. Fluctuations in US Treasury market liquidity (such as increased SRF usage at quarter-end) could push short-term yields higher, indirectly strengthening the US dollar and suppressing gold. However, risk aversion triggered by geopolitical risks (such as the Russia-Ukraine situation) or tariff rhetoric could push gold above the 3,700 resistance level and test the previous high of 3,720. Leading institutional analysts note that the recent slight increase in gold ETF holdings reflects safe-haven inflows, but the increase is limited, and subsequent data warrants attention.
Technical Analysis : Gold is currently range-bound between 3644 and 3704, with key support at 3650 (50-day moving average + psychological level) and resistance at 3700 (round number + upper Bollinger band) forming the trading framework. If it holds above 3670 (the intersection of the middle Bollinger band and the 50-day moving average), it could test 3700. If it falls below 3650, it could retest 3644 (lower Bollinger band). A breakout would require the RSI to break out of the neutral 50-60 zone and be accompanied by a strengthening negative correlation with the US dollar index. Traders should monitor the sensitivity of gold prices to US dollar fluctuations during the New York session, as well as the dynamics of the US Treasury yield curve.
The Correlation Between Gold and US Treasuries <br/>The US Treasury market's influence on gold is primarily through real yields and risk aversion. A decline in long-term US Treasury yields (if QT slows) would reduce the opportunity cost of holding gold, supporting gold prices. An increase in short-term US Treasury yields could strengthen the US dollar, temporarily suppressing gold. Geopolitical risks or market volatility (such as quarter-end liquidity tightening) could amplify gold's safe-haven properties. Traders should closely monitor the correlation between SPDR Gold ETF holdings and US Treasury yields.
Future Trend Outlook
US Dollar Index <br/>In the medium to long term, expectations of a further 25-50 basis point rate cut by the Federal Reserve this year (at the November and December FOMC meeting windows) will continue to weigh on the US dollar through US Treasury yields. The current federal funds target range is 4.0%-4.25% (adjusted after the September rate cut), and market pricing (as measured by the CME FedWatch tool) suggests interest rates could fall to 3.75%-4.0% by the end of 2025, representing a cumulative rate cut of 50-75 basis points. This will lower the yield on US dollar assets (for example, the 10-year US Treasury bond will fall from 3.7%-4.0% to 3.5%-3.8%), weakening the appeal of foreign capital inflows and putting pressure on the DXY.
Spot gold <br/>Gold is trading in the 3644-3704 range in the short term. A break above 3700 would require risk aversion or a decline in real yields. If geopolitical risks (such as the Russia-Ukraine situation) or tariff rhetoric escalate, gold prices could test 3720. If the US dollar strengthens due to liquidity demand, gold prices could retest 3644. Traders should monitor the correlation between the US dollar index and US Treasury yields, as well as how changes in ETF holdings reflect risk aversion.
US Treasury Market : Short-term US Treasury yields may rise slightly (10-20 basis points) due to quarter-end liquidity pressures, while long-term US Treasury yields may decline to 3.5%-3.8% due to the impact of rate cuts and the pace of QT. The yield curve may steepen in the short term, but its overall trend depends on the FOMC's policy guidance. Traders should be wary of the market's overreaction to Fed signals.
In summary, the trends of the US dollar and gold are highly dependent on liquidity and yield fluctuations in the US Treasury market. Traders should combine fundamentals (FOMC meetings, liquidity data) with technical indicators (Bollinger Bands, RSI, etc.) to identify breakout signals, while also paying attention to potential catalysts from geopolitical risks and risk aversion.
- Risk Warning and Disclaimer
- The market involves risk, and trading may not be suitable for all investors. This article is for reference only and does not constitute personal investment advice, nor does it take into account certain users’ specific investment objectives, financial situation, or other needs. Any investment decisions made based on this information are at your own risk.


