US Dollar Index Analysis: History May Repeat, False Signals May Prompt Another Rally
2025-09-19 13:53:58
The US dollar's nearly two-month decline may be unsustainable, mirroring the false signals triggered by last year's non-farm payroll data. The dollar fell significantly following the Federal Reserve's interest rate meeting on Wednesday (September 17), but quickly rebounded following Powell's press conference. Given that overall data continues to demonstrate economic resilience and concerns about the Fed's independence appear overblown, the market may revise its expectations for a rate cut, injecting new upward momentum into the dollar.
Looking back at the same period in 2024, the US dollar index bottomed out and rebounded, then surged 10% in the following months due to a significant revision in market expectations for Federal Reserve rate cuts. The weak non-farm payroll report in the summer ultimately proved to be a major false signal for the labor market. Looking at the current situation, the US dollar is likely about to repeat itself.

There are differences – for example, there were no concerns about the Fed’s independence at this time last year, and there is no presidential election to contend with this time – but otherwise the backdrop is strikingly similar, with markets pricing in nearly 250 basis points of rate cuts by September 2025 a year ago and 125 basis points of actual rate cuts, and labor market conditions continuing to hold up more strongly than expected.
Markets have priced in more than 100 basis points of rate cuts (excluding this week’s cut) for interest rates through September 2026. This pricing logic is once again based on concerns that an environment of low hiring and low firings will ultimately push unemployment higher.
That's certainly possible, but if you don't have access to the non-farm payroll report but do have access to all other economic data, would that data strongly suggest a need for a significant rate cut? Perhaps in real estate, but what about other sectors? Just look at this week's data: Retail sales soared; unemployment claims hit a multi-year low.
We (and certainly the Fed) appear to be placing excessive weight on a jobs report that has, for years, given false signals. The cumulative downward revisions of 1.7 million jobs over the past two years, combined with the significant downward revisions already seen in the monthly data, clearly demonstrate its unreliability. The only consistent figures are the unemployment rate and claims data, which convey a different message: the labor market is stable, not stagnant .

As was the case 12 months ago, if slowing employment fails to push up the unemployment rate, markets may need to revise their expectations for the size of rate cuts again significantly—especially if inflation continues to deviate from the 2% target. If full employment persists, it will be difficult for the Fed to dismiss the impact of tariffs on commodity prices as temporary, as this could exacerbate upward wage pressures.
Of course, the recent rise in expectations for rate cuts stems not only from concerns about the labor market but also from worries about the Federal Reserve's weakening independence. Unlike Trump's first term, when he dominated social media with his unbridled attacks, his second term has been more strategic in pushing for rate cuts—through the appointment of committee members aligned with the president's preferences. This naturally leads to the belief that interest rates could be significantly lower than they otherwise would be.
Risks do exist, but if this week's signs are any guide, the potential for a loss of Fed independence—meaning policy isn't automatically set to ultra-loose to prevent the economy from overheating—may be avoided. Granted, new FOMC member Stephen Milan dissented from the 50 basis point rate cut and is likely the one who signals the need for another 150 basis points of cuts this year, but he's clearly an outlier.
Importantly, fellow Trump appointees Christopher Waller and Michelle Bowman voted unanimously with the rest of the committee for a quarter-point rate cut, preventing a scenario where three policymakers would have supported a larger cut along political lines. While this was just one meeting, it should at least alleviate concerns that future policy will be shaped by non-economic factors.
Even if Milan is appointed as the next Fed Chair, significant rate cuts will remain elusive unless he can convince the rest of the committee to follow his lead. While his year-end rate forecast is on the low side, it's noteworthy that the median forecast for the federal funds rate this week only added one more rate cut compared to the forecast three months ago. If the market was expecting significant evidence of a weakening of the Fed's independence, this meeting unfortunately didn't provide any.
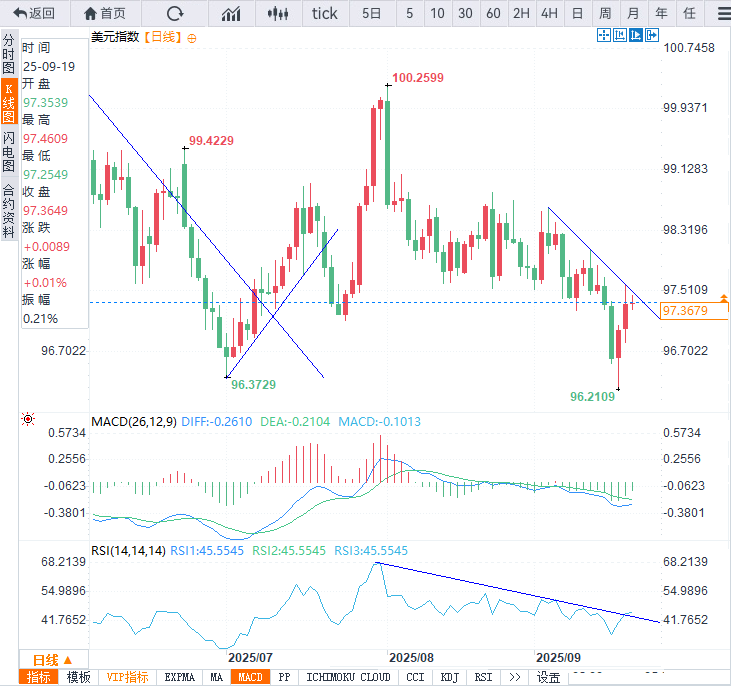
For the US dollar, combined with evidence of economic resilience beyond the non-farm payroll report, this inevitably raises questions about whether the downtrend since the "Liberation Day" tariff turmoil will continue to expand. From a technical perspective, recent price action suggests that the US dollar index may have formed a short-term bottom.
(Daily chart of the US dollar index, source: Yihuitong)
On the daily chart, the "piercing pattern" formed on Wednesday (September 17th) after the Fed meeting is a classic reversal signal—a pattern that created a new low with a gap down, only to reverse strongly in the following trading session. Follow-through buying on Thursday reinforced this signal, and prices are currently testing short-term downtrend resistance around 97.50.
Momentum indicators also showed signs of a turn: the relative strength index RSI (14) broke through the downtrend line and rebounded to the neutral level; although the MACD did not confirm the turn, its return to the signal line at least showed that the downward pressure was easing.

(US Dollar Index Weekly Chart, Source: Yihuitong)
While it's important to note that Friday's market action is still undecided, the hammer pattern on the weekly chart also constitutes a classic reversal pattern in terms of current trends. Historically, various patterns on the weekly chart of the US Dollar Index (both bullish and bearish) have often provided reliable forward-looking signals.
While not many investors trade the US Dollar Index directly, this signal can be used to assess the performance of other currency pairs, particularly EUR/USD and USD/JPY, which have a significant weighting in the US Dollar Index.
At 13:52 Beijing time, the US dollar index is currently at 97.40.
Does the US dollar trend seem familiar?
Looking back at the same period in 2024, the US dollar index bottomed out and rebounded, then surged 10% in the following months due to a significant revision in market expectations for Federal Reserve rate cuts. The weak non-farm payroll report in the summer ultimately proved to be a major false signal for the labor market. Looking at the current situation, the US dollar is likely about to repeat itself.
There are differences – for example, there were no concerns about the Fed’s independence at this time last year, and there is no presidential election to contend with this time – but otherwise the backdrop is strikingly similar, with markets pricing in nearly 250 basis points of rate cuts by September 2025 a year ago and 125 basis points of actual rate cuts, and labor market conditions continuing to hold up more strongly than expected.
Beware of summer non-farm payroll false signals
Markets have priced in more than 100 basis points of rate cuts (excluding this week’s cut) for interest rates through September 2026. This pricing logic is once again based on concerns that an environment of low hiring and low firings will ultimately push unemployment higher.
That's certainly possible, but if you don't have access to the non-farm payroll report but do have access to all other economic data, would that data strongly suggest a need for a significant rate cut? Perhaps in real estate, but what about other sectors? Just look at this week's data: Retail sales soared; unemployment claims hit a multi-year low.
We (and certainly the Fed) appear to be placing excessive weight on a jobs report that has, for years, given false signals. The cumulative downward revisions of 1.7 million jobs over the past two years, combined with the significant downward revisions already seen in the monthly data, clearly demonstrate its unreliability. The only consistent figures are the unemployment rate and claims data, which convey a different message: the labor market is stable, not stagnant .
As was the case 12 months ago, if slowing employment fails to push up the unemployment rate, markets may need to revise their expectations for the size of rate cuts again significantly—especially if inflation continues to deviate from the 2% target. If full employment persists, it will be difficult for the Fed to dismiss the impact of tariffs on commodity prices as temporary, as this could exacerbate upward wage pressures.
The controversy over the independence of the Federal Reserve
Of course, the recent rise in expectations for rate cuts stems not only from concerns about the labor market but also from worries about the Federal Reserve's weakening independence. Unlike Trump's first term, when he dominated social media with his unbridled attacks, his second term has been more strategic in pushing for rate cuts—through the appointment of committee members aligned with the president's preferences. This naturally leads to the belief that interest rates could be significantly lower than they otherwise would be.
Risks do exist, but if this week's signs are any guide, the potential for a loss of Fed independence—meaning policy isn't automatically set to ultra-loose to prevent the economy from overheating—may be avoided. Granted, new FOMC member Stephen Milan dissented from the 50 basis point rate cut and is likely the one who signals the need for another 150 basis points of cuts this year, but he's clearly an outlier.
Importantly, fellow Trump appointees Christopher Waller and Michelle Bowman voted unanimously with the rest of the committee for a quarter-point rate cut, preventing a scenario where three policymakers would have supported a larger cut along political lines. While this was just one meeting, it should at least alleviate concerns that future policy will be shaped by non-economic factors.
Even if Milan is appointed as the next Fed Chair, significant rate cuts will remain elusive unless he can convince the rest of the committee to follow his lead. While his year-end rate forecast is on the low side, it's noteworthy that the median forecast for the federal funds rate this week only added one more rate cut compared to the forecast three months ago. If the market was expecting significant evidence of a weakening of the Fed's independence, this meeting unfortunately didn't provide any.
Is the dollar's rebound momentum accumulating?
For the US dollar, combined with evidence of economic resilience beyond the non-farm payroll report, this inevitably raises questions about whether the downtrend since the "Liberation Day" tariff turmoil will continue to expand. From a technical perspective, recent price action suggests that the US dollar index may have formed a short-term bottom.
(Daily chart of the US dollar index, source: Yihuitong)
On the daily chart, the "piercing pattern" formed on Wednesday (September 17th) after the Fed meeting is a classic reversal signal—a pattern that created a new low with a gap down, only to reverse strongly in the following trading session. Follow-through buying on Thursday reinforced this signal, and prices are currently testing short-term downtrend resistance around 97.50.
Momentum indicators also showed signs of a turn: the relative strength index RSI (14) broke through the downtrend line and rebounded to the neutral level; although the MACD did not confirm the turn, its return to the signal line at least showed that the downward pressure was easing.
(US Dollar Index Weekly Chart, Source: Yihuitong)
While it's important to note that Friday's market action is still undecided, the hammer pattern on the weekly chart also constitutes a classic reversal pattern in terms of current trends. Historically, various patterns on the weekly chart of the US Dollar Index (both bullish and bearish) have often provided reliable forward-looking signals.
While not many investors trade the US Dollar Index directly, this signal can be used to assess the performance of other currency pairs, particularly EUR/USD and USD/JPY, which have a significant weighting in the US Dollar Index.
At 13:52 Beijing time, the US dollar index is currently at 97.40.
- Risk Warning and Disclaimer
- The market involves risk, and trading may not be suitable for all investors. This article is for reference only and does not constitute personal investment advice, nor does it take into account certain users’ specific investment objectives, financial situation, or other needs. Any investment decisions made based on this information are at your own risk.