Crude oil trading reminder: The easing of geopolitical tensions has put pressure on oil prices to fall back to the lower edge of the box, waiting to stabilize.
2025-10-10 09:15:20
In early Asian trading on Friday, West Texas Intermediate (WTI) crude oil continued its downward trend, trading at $61.20 per barrel. Market research indicates that Israel and Hamas have formally signed a ceasefire agreement, marking a temporary easing of tensions in the Middle East.
The agreement includes arrangements for a partial troop withdrawal and the release of detained individuals, which the market generally believes will reduce the risk of crude oil supply disruptions. As the Middle East is the source of approximately one-third of global crude oil exports, the decline in geopolitical risk premiums has put short-term pressure on WTI.
Meanwhile, the US government shutdown has lasted for ten days, with Congress still failing to pass a budget bill, causing some federal agencies to shut down. The market is concerned that this will weaken US economic vitality and curb energy consumption demand.

Analysts pointed out that if the fiscal deadlock is prolonged, it will not only affect government spending, but may also cool down manufacturing and transportation activities, thereby further lowering the crude oil demand curve.
On the supply side, Russia-Ukraine negotiations remain stalled, raising concerns among investors about the potential protracted nature of energy sanctions. Given Russia's significant global crude oil exports, any new sanctions could reduce supply, providing some support for WTI.
However, this support is limited and it is difficult to reverse the overall weak situation.
Energy analyst Mark Dawson said: "The ceasefire agreement has brought short-term relief, but the market focus is shifting to the macroeconomic level. If the US fiscal deadlock continues, demand pressure will become the main obstacle to the rebound of oil prices."
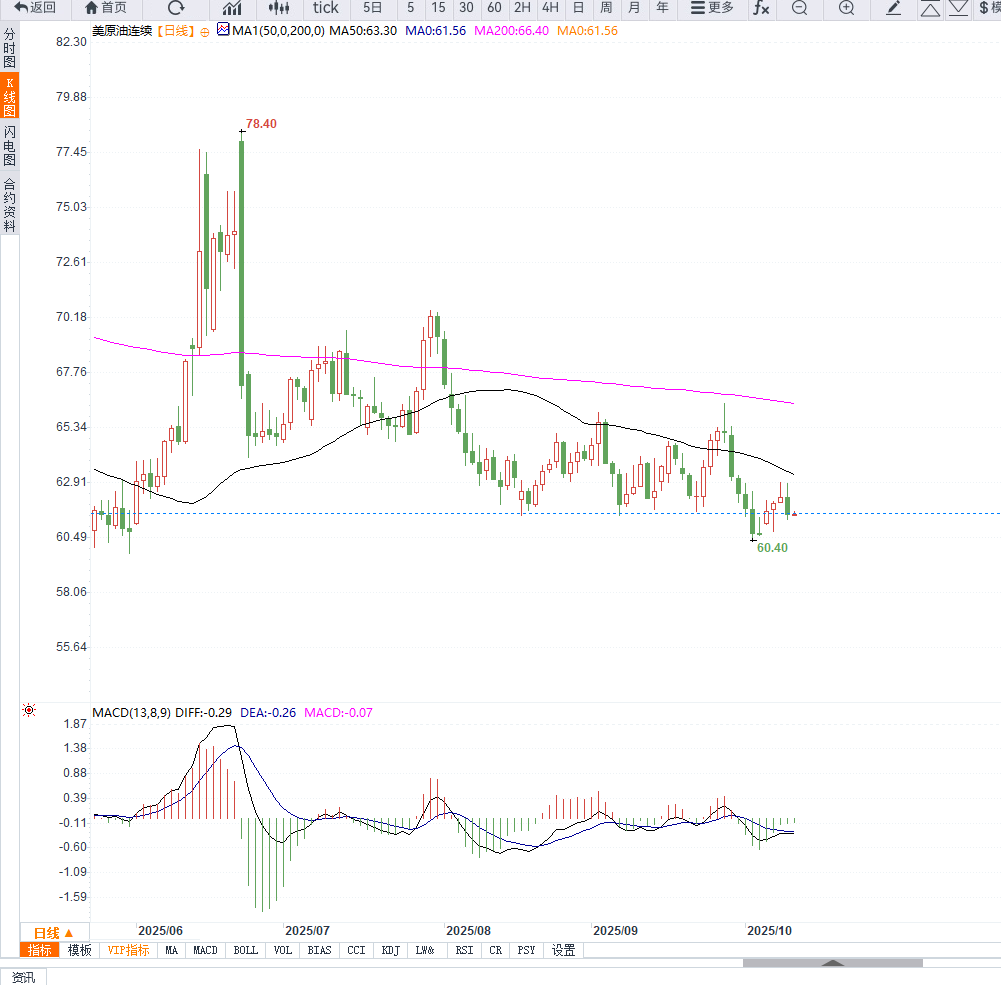
Technically, WTI's daily price chart shows a continued decline since its mid-September high of $67.40 per barrel, currently trading near the $61 support range. The candlestick chart has shown consecutive small negative candlestick patterns, reflecting a market consolidation at low levels and a lack of buying interest.
In terms of technical indicators, the 20-day moving average crossed below the 50-day moving average to form a bearish arrangement, indicating that the short-term trend is still weak; the red column of the MACD indicator shortened and approached the zero axis, indicating insufficient momentum; the RSI (Relative Strength Index) remained around 42, which was in a slightly oversold state, suggesting that oil prices may receive temporary support in the range of US$60.80-61.50.
If it falls below $60.80, the next support level is around $59.80; if it can break through the $62.50 resistance, a mild rebound is expected.
Technical consultant Elena Petrova pointed out: "WTI's short-term downward trend has not ended, but the market is in a low consolidation zone, and we need to pay attention to the support strength of the $60 round mark."
Editor's opinion:
WTI's current trend reflects the fading of political risks and the dominance of economic expectations. The easing of tensions in the Middle East has eroded upward momentum in oil prices, while the US fiscal impasse has heightened uncertainty on the demand side.
Technically, WTI has some support around $60, but significant upward pressure is evident, making it difficult to break through the $62.50 resistance level in the short term. If the US fiscal crisis remains unresolved over the next two weeks, oil prices may test the support range below $60.
Overall, the market is entering a stage of transition from geopolitical drive to macroeconomic drive, and more attention should be paid to changes in US economic data and energy inventories to judge the direction of oil prices.
The agreement includes arrangements for a partial troop withdrawal and the release of detained individuals, which the market generally believes will reduce the risk of crude oil supply disruptions. As the Middle East is the source of approximately one-third of global crude oil exports, the decline in geopolitical risk premiums has put short-term pressure on WTI.
Meanwhile, the US government shutdown has lasted for ten days, with Congress still failing to pass a budget bill, causing some federal agencies to shut down. The market is concerned that this will weaken US economic vitality and curb energy consumption demand.
Analysts pointed out that if the fiscal deadlock is prolonged, it will not only affect government spending, but may also cool down manufacturing and transportation activities, thereby further lowering the crude oil demand curve.
On the supply side, Russia-Ukraine negotiations remain stalled, raising concerns among investors about the potential protracted nature of energy sanctions. Given Russia's significant global crude oil exports, any new sanctions could reduce supply, providing some support for WTI.
However, this support is limited and it is difficult to reverse the overall weak situation.
Energy analyst Mark Dawson said: "The ceasefire agreement has brought short-term relief, but the market focus is shifting to the macroeconomic level. If the US fiscal deadlock continues, demand pressure will become the main obstacle to the rebound of oil prices."
Technically, WTI's daily price chart shows a continued decline since its mid-September high of $67.40 per barrel, currently trading near the $61 support range. The candlestick chart has shown consecutive small negative candlestick patterns, reflecting a market consolidation at low levels and a lack of buying interest.
In terms of technical indicators, the 20-day moving average crossed below the 50-day moving average to form a bearish arrangement, indicating that the short-term trend is still weak; the red column of the MACD indicator shortened and approached the zero axis, indicating insufficient momentum; the RSI (Relative Strength Index) remained around 42, which was in a slightly oversold state, suggesting that oil prices may receive temporary support in the range of US$60.80-61.50.
If it falls below $60.80, the next support level is around $59.80; if it can break through the $62.50 resistance, a mild rebound is expected.
Technical consultant Elena Petrova pointed out: "WTI's short-term downward trend has not ended, but the market is in a low consolidation zone, and we need to pay attention to the support strength of the $60 round mark."
Editor's opinion:
WTI's current trend reflects the fading of political risks and the dominance of economic expectations. The easing of tensions in the Middle East has eroded upward momentum in oil prices, while the US fiscal impasse has heightened uncertainty on the demand side.
Technically, WTI has some support around $60, but significant upward pressure is evident, making it difficult to break through the $62.50 resistance level in the short term. If the US fiscal crisis remains unresolved over the next two weeks, oil prices may test the support range below $60.
Overall, the market is entering a stage of transition from geopolitical drive to macroeconomic drive, and more attention should be paid to changes in US economic data and energy inventories to judge the direction of oil prices.
- Risk Warning and Disclaimer
- The market involves risk, and trading may not be suitable for all investors. This article is for reference only and does not constitute personal investment advice, nor does it take into account certain users’ specific investment objectives, financial situation, or other needs. Any investment decisions made based on this information are at your own risk.