Is the myth of gold as a safe haven over? After a 57% surge, it crashed from its highs. Multiple perspectives reveal the secrets.
2025-10-23 21:57:55
On Thursday (October 23) in the European and American sessions, spot gold fluctuated widely, holding the main position of Wednesday's rebound.
Gold has continued its impressive performance this year, with prices surging 57%, driven by geopolitical tensions, economic uncertainty, expectations of US interest rate cuts, and strong inflows into ETFs. This impressive performance is largely due to robust global demand for safe-haven assets. However, the recent easing of international trade tensions and the initial signs of peace between Russia and Ukraine have partially weakened gold's safe-haven appeal. Furthermore, with the release of US CPI data and the upcoming key meetings, it's not surprising that investors are taking profits at high levels.
There's a classic saying in the trading world: "When it rises, rely on momentum; when it falls, rely on quality." What's driving the current surge in gold prices? What's the quality and support for gold's decline? Besides fundamental news, what other factors influence gold prices? This article attempts to briefly outline current market perspectives.
In addition to hedging spot profits and locking in profits, futures have also become a one-way profit path for investment speculators. Futures highs are often the result of closing short positions after being squeezed out. There is a view in the market that the price of spot silver before 54 was enough to cover the profit of physical silver airlifted to London for delivery.
The arbitrage space between them may have made silver bears target the silver market, and the final surge in silver prices forced the bears to close their positions and become the last bulls, which also marked the end of silver's final acceleration force.
The same principle applies to gold. As prices continue to soar, traders need to constantly weigh the marginal cost of continuing to hold positions and the marginal benefits of selling now. When they feel the risk of rising prices, they will choose to sell, which also makes the medium- and long-term fundamental narrative fail at that point in time.
This is also where technical analysis usually comes into play. In previous articles, the author was fortunate to obtain many clues about the upcoming market adjustments through technical analysis.
The market is always accustomed to buying expectations and selling reality. Before the critical time node arrives, smart funds will choose to cash out in advance, and concentrated cashing out usually leads to violent ups and downs.
Previous short-term factors affecting gold prices include U.S. trade concerns, the U.S. government shutdown, and the Federal Reserve's interest rate meeting. The Federal Open Market Committee (FOMC) will hold an interest rate meeting from October 29 to 30, the U.S. Consumer Price Index (CPI) report will be released this Friday, and a White House spokesman also announced that the government shutdown may be lifted at the end of the month. The Asia-Pacific Economic Cooperation (APEC) summit in South Korea will be held at the end of this month, which are all clear fulfillment nodes.
Meanwhile, there are reports that the United States has not yet joined the EU in using frozen assets to aid Ukraine, nor has it provided Ukraine with new long-range weapons. These are key flashpoints, and it's no surprise that these investors, already reaping significant profits, are choosing to cash in their gains before these milestones.
Previous articles have also reminded investors of these key time nodes.
With the average American earning $36.50 an hour, the average American now has to work 116 hours to afford an ounce of gold - the highest record in the past century.
A little over a year ago, working 50 hours could buy one ounce of gold, but in just 18 months, as the price of gold soared, this "time cost" doubled. In other words, the price of gold rose much faster than wages.
Historically, during peak gold prices in the 1930s, 1980, and 2011, people only needed about 80 hours of labor. At the beginning of this century, it was less than 20 hours. If we assume an 80-hour labor period, unless the average wage in the United States rises, the price of gold should be around $3,000.
(Gold price to U.S. average hourly wage ratio trend chart)
At the same time, the bond market also suggested that during the period of gold plummeting, the 10-year U.S. Treasury bond has been falling and the U.S. dollar index has continued to rise, indicating that the market's demand for safe-haven assets has not decreased, but gold has become a risky asset due to its continuous rise, and thus has not been chosen by funds.
The above market views explain the reasons for the accelerated and rapid adjustment of gold prices, and also give the bottom area of gold prices.
But the gold price is not that simple. The expectation of a Federal Reserve interest rate cut, geopolitical risks and the uncertainty brought about by the US government shutdown have jointly provided bottom support for the gold price.
At the same time, in the long run, the diversification of gold purchases and foreign exchange reserves by central banks of various countries, as well as global economic uncertainty, continued geopolitical tensions, and the trends of the US dollar and US Treasury yields will continue to be core factors affecting gold prices.
The spot gold intraday chart shows that the price has broken through the circled box and reached the 4144 level, marking a significant increase. It has also surpassed the key 4125 level. It remains to be seen whether the price can hold above 4125, the neckline of the double bottom. 4125 is the dividing line between bulls and bears in this rebound. If it holds, the price is expected to break through the large box and challenge 4240.
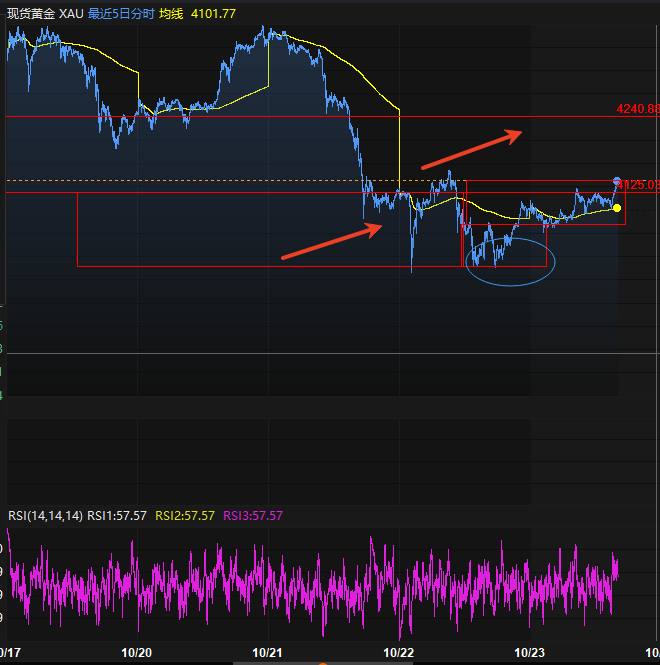
(Spot gold time-sharing chart)
The daily spot gold chart shows that spot gold is holding within the middle track of the ascending channel, currently constrained by the intersection of the 5-day and 10-day moving averages and the upper track of the channel. The MACD has formed a high-level death crossover, and since the daily chart has not launched a significant attack on the October 21st bearish candlestick pattern, the rebound is weak.
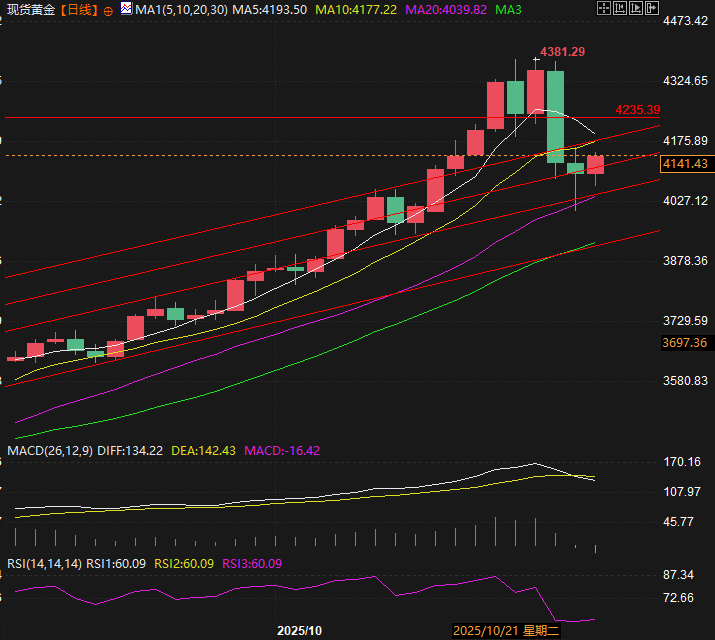
(Spot gold daily chart, source: Yihuitong)
At 21:48 Beijing time, spot gold was trading at $4,143 per ounce.
Gold has continued its impressive performance this year, with prices surging 57%, driven by geopolitical tensions, economic uncertainty, expectations of US interest rate cuts, and strong inflows into ETFs. This impressive performance is largely due to robust global demand for safe-haven assets. However, the recent easing of international trade tensions and the initial signs of peace between Russia and Ukraine have partially weakened gold's safe-haven appeal. Furthermore, with the release of US CPI data and the upcoming key meetings, it's not surprising that investors are taking profits at high levels.
There's a classic saying in the trading world: "When it rises, rely on momentum; when it falls, rely on quality." What's driving the current surge in gold prices? What's the quality and support for gold's decline? Besides fundamental news, what other factors influence gold prices? This article attempts to briefly outline current market perspectives.
Viewpoint 1: The acceleration period is caused by short squeeze, so it will fall back quickly after acceleration
In addition to hedging spot profits and locking in profits, futures have also become a one-way profit path for investment speculators. Futures highs are often the result of closing short positions after being squeezed out. There is a view in the market that the price of spot silver before 54 was enough to cover the profit of physical silver airlifted to London for delivery.
The arbitrage space between them may have made silver bears target the silver market, and the final surge in silver prices forced the bears to close their positions and become the last bulls, which also marked the end of silver's final acceleration force.
The same principle applies to gold. As prices continue to soar, traders need to constantly weigh the marginal cost of continuing to hold positions and the marginal benefits of selling now. When they feel the risk of rising prices, they will choose to sell, which also makes the medium- and long-term fundamental narrative fail at that point in time.
This is also where technical analysis usually comes into play. In previous articles, the author was fortunate to obtain many clues about the upcoming market adjustments through technical analysis.
Viewpoint 2: The market always trades expectations and delivers on reality
The market is always accustomed to buying expectations and selling reality. Before the critical time node arrives, smart funds will choose to cash out in advance, and concentrated cashing out usually leads to violent ups and downs.
Previous short-term factors affecting gold prices include U.S. trade concerns, the U.S. government shutdown, and the Federal Reserve's interest rate meeting. The Federal Open Market Committee (FOMC) will hold an interest rate meeting from October 29 to 30, the U.S. Consumer Price Index (CPI) report will be released this Friday, and a White House spokesman also announced that the government shutdown may be lifted at the end of the month. The Asia-Pacific Economic Cooperation (APEC) summit in South Korea will be held at the end of this month, which are all clear fulfillment nodes.
Meanwhile, there are reports that the United States has not yet joined the EU in using frozen assets to aid Ukraine, nor has it provided Ukraine with new long-range weapons. These are key flashpoints, and it's no surprise that these investors, already reaping significant profits, are choosing to cash in their gains before these milestones.
Previous articles have also reminded investors of these key time nodes.
Viewpoint 3: Gold prices are too high and deviate from fundamentals
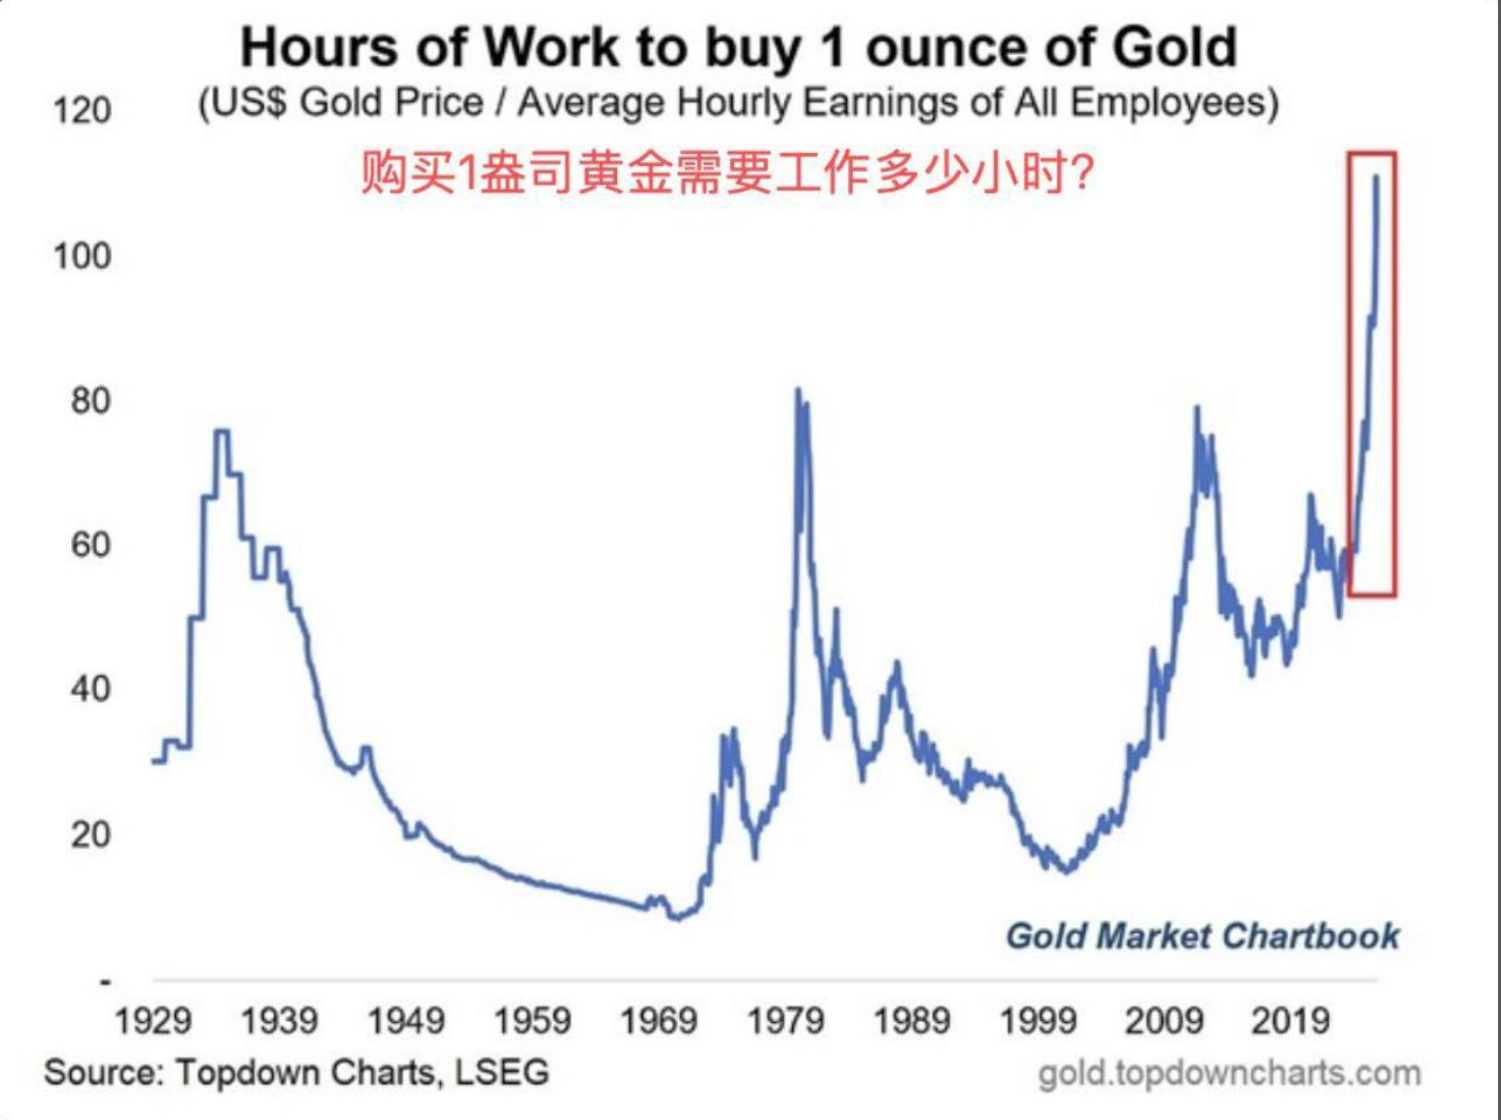
With the average American earning $36.50 an hour, the average American now has to work 116 hours to afford an ounce of gold - the highest record in the past century.
A little over a year ago, working 50 hours could buy one ounce of gold, but in just 18 months, as the price of gold soared, this "time cost" doubled. In other words, the price of gold rose much faster than wages.
Historically, during peak gold prices in the 1930s, 1980, and 2011, people only needed about 80 hours of labor. At the beginning of this century, it was less than 20 hours. If we assume an 80-hour labor period, unless the average wage in the United States rises, the price of gold should be around $3,000.
(Gold price to U.S. average hourly wage ratio trend chart)
At the same time, the bond market also suggested that during the period of gold plummeting, the 10-year U.S. Treasury bond has been falling and the U.S. dollar index has continued to rise, indicating that the market's demand for safe-haven assets has not decreased, but gold has become a risky asset due to its continuous rise, and thus has not been chosen by funds.
Summarize:
The above market views explain the reasons for the accelerated and rapid adjustment of gold prices, and also give the bottom area of gold prices.
But the gold price is not that simple. The expectation of a Federal Reserve interest rate cut, geopolitical risks and the uncertainty brought about by the US government shutdown have jointly provided bottom support for the gold price.
At the same time, in the long run, the diversification of gold purchases and foreign exchange reserves by central banks of various countries, as well as global economic uncertainty, continued geopolitical tensions, and the trends of the US dollar and US Treasury yields will continue to be core factors affecting gold prices.
Technical Analysis:
The spot gold intraday chart shows that the price has broken through the circled box and reached the 4144 level, marking a significant increase. It has also surpassed the key 4125 level. It remains to be seen whether the price can hold above 4125, the neckline of the double bottom. 4125 is the dividing line between bulls and bears in this rebound. If it holds, the price is expected to break through the large box and challenge 4240.
(Spot gold time-sharing chart)
The daily spot gold chart shows that spot gold is holding within the middle track of the ascending channel, currently constrained by the intersection of the 5-day and 10-day moving averages and the upper track of the channel. The MACD has formed a high-level death crossover, and since the daily chart has not launched a significant attack on the October 21st bearish candlestick pattern, the rebound is weak.
(Spot gold daily chart, source: Yihuitong)
At 21:48 Beijing time, spot gold was trading at $4,143 per ounce.
- Risk Warning and Disclaimer
- The market involves risk, and trading may not be suitable for all investors. This article is for reference only and does not constitute personal investment advice, nor does it take into account certain users’ specific investment objectives, financial situation, or other needs. Any investment decisions made based on this information are at your own risk.