The US dollar's "battle of wits": Technicals are pushing it to the hole, but fundamentals are digging a hole.
2025-11-03 19:44:26
On Monday (November 3), the US dollar index saw a modest rebound during Asian and European trading sessions, with spot prices fluctuating narrowly near key technical resistance levels. As of this writing, the dollar index was quoted at 99.8739, up slightly by 0.17% on the day, reflecting cautious buying sentiment as the market awaits further guidance. While technical factors offer some short-term support, fundamentals are challenged by uncertainties surrounding the US domestic economy and policies. This short-term divergence between fundamentals and technicals is the main characteristic of the current market.

American consumers have been a mainstay of the resilience of the US economy, but the latest analysis shows that this resilience is facing a severe test, especially among low- and middle-income groups.
Chief economists at leading institutions point out that low-income families are facing budget constraints due to rising healthcare costs, a potential disruption to federal food assistance (SNAP), and uncertainty surrounding the job market outlook. With the important Thanksgiving and Christmas shopping season approaching, the ongoing government shutdown not only cuts off benefits for low-income groups but also disrupts the flow of crucial economic data, making it difficult for policymakers like the Federal Reserve to assess the true state of the economy.
Furthermore, experts from the organization also mentioned the "K-shaped economy" phenomenon, where high-income households benefit from a rising stock market and experience strong consumption, while low-income groups face pressure, manifested in increased auto loan defaults and more frugal spending patterns. Federal Reserve Chairman Jerome Powell has also pointed out this "polarization" pattern.
Policy uncertainty is also casting a shadow over the economic outlook. Tariff rhetoric, the budget impasse over the Affordable Care Act (ACA) subsidies, and a potential government shutdown could drag down fourth-quarter economic growth by up to one percentage point. While some analysts expect tax rebates early next year to provide some offsetting effect, these adverse policy shocks will test the resilience of the US economy in the short term, putting pressure on the dollar's fundamental valuation. This anxiety is creating risk aversion in the market, but it may also support the dollar in the short term due to its safe-haven status, creating a complex and intertwined effect.
The current 60-minute chart of the US dollar index shows signs of short-term bulls gaining the upper hand, but momentum may face the risk of short-term exhaustion.
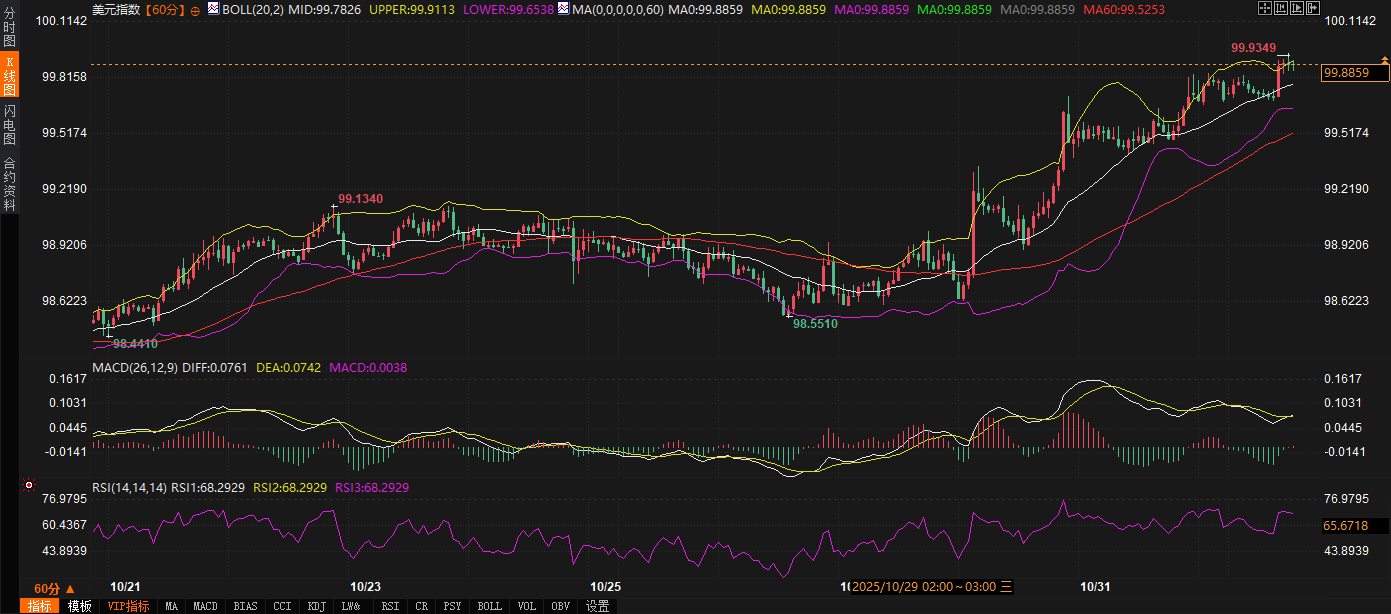
Technical Analysis: The US Dollar Index is trading at 99.8739, clearly above the 60-period simple moving average (60SMA: 99.5253), establishing a short-term bullish technical tone. Simultaneously, the price has broken through the Bollinger Band middle line (99.7820) and even touched the upper line (99.9090). This indicates that during the intraday trading session, buying power was concentrated, driving the index upward.
Indicator Analysis: The Relative Strength Index (RSI 14) is at 66.7323. Although it has not yet entered the overbought zone (above 70), it is already in the strong zone, reflecting sufficient short-term momentum. However, the index is approaching the upper Bollinger Band, and the distance between the upper and middle bands is relatively limited, suggesting that the index may face a slowdown in upward momentum or a pullback in the short term.
MACD Analysis: The Moving Average Convergence Divergence (MACD) lines DIFF (0.0754) and DEA (0.0741) are both above the zero line, with DIFF slightly higher than DEA. The MACD histogram (0.0024) has slightly increased, which is a mild bullish signal, indicating that the short-term rebound trend of the index is being maintained. However, the histogram values are small, suggesting that the bullish momentum is not yet strong enough and a reversal may occur at any time.
Trend Forecast: Given that the price is approaching the upper Bollinger Band and the RSI is at a high level, the index may consolidate around the upper band in the short term. If it can effectively break through the resistance near 99.91 and hold above it, it may test the 100.00 psychological level. Conversely, if it falls back from the upper band and breaks below the middle band at 99.7820, it may retrace to the 60-day SMA at 99.5253 for support.
Based on our analysis of the US Dollar Index futures contract, we are focusing on the following key ranges:
Short-term resistance: 99.90 - 100.00; a strong resistance zone formed by the upper Bollinger Band and the psychological level of 100.00. Intraday trading should focus on how the price tests the upper Bollinger Band at 99.91; failure to break through effectively could trigger short-term profit-taking pressure.
Short-term support: 99.75 - 99.80; near the 60-minute Bollinger Band middle line (99.7820), this area is key for the bulls to maintain their advantage in the short term. If the price breaks below this level during the session, it indicates that the short-term upward trend has been thwarted.
Strong support; 99.50 - 99.55; the area where the 60-period SMA (99.5253) is located. This is a key watershed for the short-term trend; if this level holds, the rebound pattern remains; if it falls, the short-term trend may turn downward.
Based on a comprehensive analysis of both fundamental and technical factors, the US dollar index faces a complex situation of mixed bullish and bearish sentiment in the short term.
Technically, while the bulls hold the advantage in the short term, they have already touched the upper Bollinger Band, and there is a risk of momentum exhaustion. The index is likely to consolidate within a range at high levels. This consolidation provides time for fundamental factors to exert their influence.
Looking ahead, pressures on consumer spending and policy uncertainties (such as government shutdowns and tariff rhetoric) pose potential medium- to long-term downside risks to the US dollar. However, in the absence of key economic data releases, market focus may shift to risk aversion, which could provide some support for the dollar in the short term.
Therefore, the short-term trend of the US dollar index will involve repeated fluctuations around key technical ranges. The market needs to wait for the resolution of the US government shutdown and the subsequent release of economic data to provide clearer directional guidance for the dollar index. Until then, the index is likely to seek a directional breakout within the 99.50 to 100.00 range.
Fundamentals: Consumption momentum faces challenges, and policy uncertainty is rising.
American consumers have been a mainstay of the resilience of the US economy, but the latest analysis shows that this resilience is facing a severe test, especially among low- and middle-income groups.
Chief economists at leading institutions point out that low-income families are facing budget constraints due to rising healthcare costs, a potential disruption to federal food assistance (SNAP), and uncertainty surrounding the job market outlook. With the important Thanksgiving and Christmas shopping season approaching, the ongoing government shutdown not only cuts off benefits for low-income groups but also disrupts the flow of crucial economic data, making it difficult for policymakers like the Federal Reserve to assess the true state of the economy.
Furthermore, experts from the organization also mentioned the "K-shaped economy" phenomenon, where high-income households benefit from a rising stock market and experience strong consumption, while low-income groups face pressure, manifested in increased auto loan defaults and more frugal spending patterns. Federal Reserve Chairman Jerome Powell has also pointed out this "polarization" pattern.
Policy uncertainty is also casting a shadow over the economic outlook. Tariff rhetoric, the budget impasse over the Affordable Care Act (ACA) subsidies, and a potential government shutdown could drag down fourth-quarter economic growth by up to one percentage point. While some analysts expect tax rebates early next year to provide some offsetting effect, these adverse policy shocks will test the resilience of the US economy in the short term, putting pressure on the dollar's fundamental valuation. This anxiety is creating risk aversion in the market, but it may also support the dollar in the short term due to its safe-haven status, creating a complex and intertwined effect.
Technical Analysis: The 60-minute chart shows bulls in control; watch for Bollinger Band convergence.
The current 60-minute chart of the US dollar index shows signs of short-term bulls gaining the upper hand, but momentum may face the risk of short-term exhaustion.
Technical Analysis: The US Dollar Index is trading at 99.8739, clearly above the 60-period simple moving average (60SMA: 99.5253), establishing a short-term bullish technical tone. Simultaneously, the price has broken through the Bollinger Band middle line (99.7820) and even touched the upper line (99.9090). This indicates that during the intraday trading session, buying power was concentrated, driving the index upward.
Indicator Analysis: The Relative Strength Index (RSI 14) is at 66.7323. Although it has not yet entered the overbought zone (above 70), it is already in the strong zone, reflecting sufficient short-term momentum. However, the index is approaching the upper Bollinger Band, and the distance between the upper and middle bands is relatively limited, suggesting that the index may face a slowdown in upward momentum or a pullback in the short term.
MACD Analysis: The Moving Average Convergence Divergence (MACD) lines DIFF (0.0754) and DEA (0.0741) are both above the zero line, with DIFF slightly higher than DEA. The MACD histogram (0.0024) has slightly increased, which is a mild bullish signal, indicating that the short-term rebound trend of the index is being maintained. However, the histogram values are small, suggesting that the bullish momentum is not yet strong enough and a reversal may occur at any time.
Trend Forecast: Given that the price is approaching the upper Bollinger Band and the RSI is at a high level, the index may consolidate around the upper band in the short term. If it can effectively break through the resistance near 99.91 and hold above it, it may test the 100.00 psychological level. Conversely, if it falls back from the upper band and breaks below the middle band at 99.7820, it may retrace to the 60-day SMA at 99.5253 for support.
Support and resistance range prediction: DXY
Based on our analysis of the US Dollar Index futures contract, we are focusing on the following key ranges:
Short-term resistance: 99.90 - 100.00; a strong resistance zone formed by the upper Bollinger Band and the psychological level of 100.00. Intraday trading should focus on how the price tests the upper Bollinger Band at 99.91; failure to break through effectively could trigger short-term profit-taking pressure.
Short-term support: 99.75 - 99.80; near the 60-minute Bollinger Band middle line (99.7820), this area is key for the bulls to maintain their advantage in the short term. If the price breaks below this level during the session, it indicates that the short-term upward trend has been thwarted.
Strong support; 99.50 - 99.55; the area where the 60-period SMA (99.5253) is located. This is a key watershed for the short-term trend; if this level holds, the rebound pattern remains; if it falls, the short-term trend may turn downward.
Future Trend Outlook: A Mixed Landscape of Bullish and Bearish Sentiments, Awaiting a Directional Breakout
Based on a comprehensive analysis of both fundamental and technical factors, the US dollar index faces a complex situation of mixed bullish and bearish sentiment in the short term.
Technically, while the bulls hold the advantage in the short term, they have already touched the upper Bollinger Band, and there is a risk of momentum exhaustion. The index is likely to consolidate within a range at high levels. This consolidation provides time for fundamental factors to exert their influence.
Looking ahead, pressures on consumer spending and policy uncertainties (such as government shutdowns and tariff rhetoric) pose potential medium- to long-term downside risks to the US dollar. However, in the absence of key economic data releases, market focus may shift to risk aversion, which could provide some support for the dollar in the short term.
Therefore, the short-term trend of the US dollar index will involve repeated fluctuations around key technical ranges. The market needs to wait for the resolution of the US government shutdown and the subsequent release of economic data to provide clearer directional guidance for the dollar index. Until then, the index is likely to seek a directional breakout within the 99.50 to 100.00 range.
- Risk Warning and Disclaimer
- The market involves risk, and trading may not be suitable for all investors. This article is for reference only and does not constitute personal investment advice, nor does it take into account certain users’ specific investment objectives, financial situation, or other needs. Any investment decisions made based on this information are at your own risk.