The US Treasury yield curve game achieves a "soft landing," and gold and the US dollar reach a new crossroads.
2025-11-05 20:36:30
On Wednesday (November 5), most U.S. Treasury yields fell, but longer-term yields showed signs of stabilization. The two-year yield fell 1.4 basis points to 3.570%, the ten-year yield fell 0.6 basis points to 4.085%, and the thirty-year yield remained unchanged at 4.671%. Meanwhile, the one-year yield rose slightly, pushing the yield curve steeper. Trading was thin as investors awaited upcoming ADP employment data and the ISM services PMI for further directional guidance. The upcoming U.S. Treasury refinancing plan is also attracting attention, but the market expects its contents to be conventional. In the currency market, the dollar index fell slightly by 0.04% to 100.1644; while spot gold bucked the trend, rising 0.84% to $3964.76 per ounce, indicating a flow of safe-haven funds between bonds and gold.

The shifts in the US Treasury yield curve clearly reflect the market's tiered expectations for the US economy. The slight rise in the one-year yield stems from recent resilient employment and inflation data, leading traders to believe the Federal Reserve will not rush to cut interest rates in the short term, thus avoiding the immediate risk of a hard landing. Meanwhile, the decline in yields for maturities of two years and beyond indicates that investors are more cautious about the medium-term outlook: while short-term economic momentum is solid, the growth path over two to ten years may slow, while inflationary pressures are expected to gradually subside.
This expectation is supported by solid fundamentals. The Federal Reserve's maintenance of high interest rates has effectively anchored short-term yields; meanwhile, the continued recovery of global supply chains and the stabilization of geopolitical situations have also mitigated the tail risks of long-term inflation. Some institutions point out that the current yield curve shape is similar to the adjustment phase in mid-2024, when the market also reached a consensus on a "soft landing" amidst data tug-of-war. Going forward, key macroeconomic data will be the decisive factor: if ADP employment data is stronger than expected, it will solidify short-term economic resilience; conversely, if the ISM services PMI falls below the 50-point threshold, it will exacerbate concerns about the medium- to long-term economy and may further steepen the yield curve. While the Treasury's refinancing announcement was not unexpected, its scale and maturity structure will still affect the market's assessment of debt sustainability. If it leans towards long-term bond issuance, it may raise concerns about future supply pressures.
From a technical perspective, the trends of US Treasury bonds, the US dollar, and gold together construct a coherent market narrative.
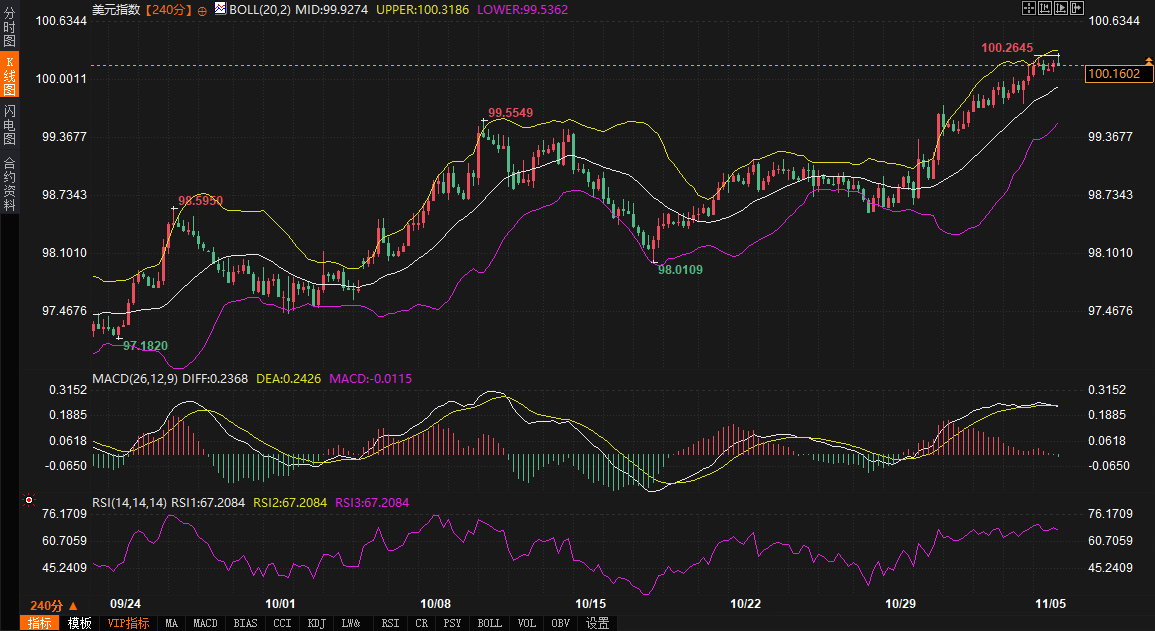
The US dollar index is hovering around the middle Bollinger Band at 99.93 on the 240-minute chart. The MACD indicator shows a slight divergence, but the RSI has risen to 67.20, indicating that while short-term momentum has slowed, the overall trend remains sideways, and it has not yet effectively tested the upper Bollinger Band resistance at 100.32. This echoes the firmness of short-term US Treasury yields.
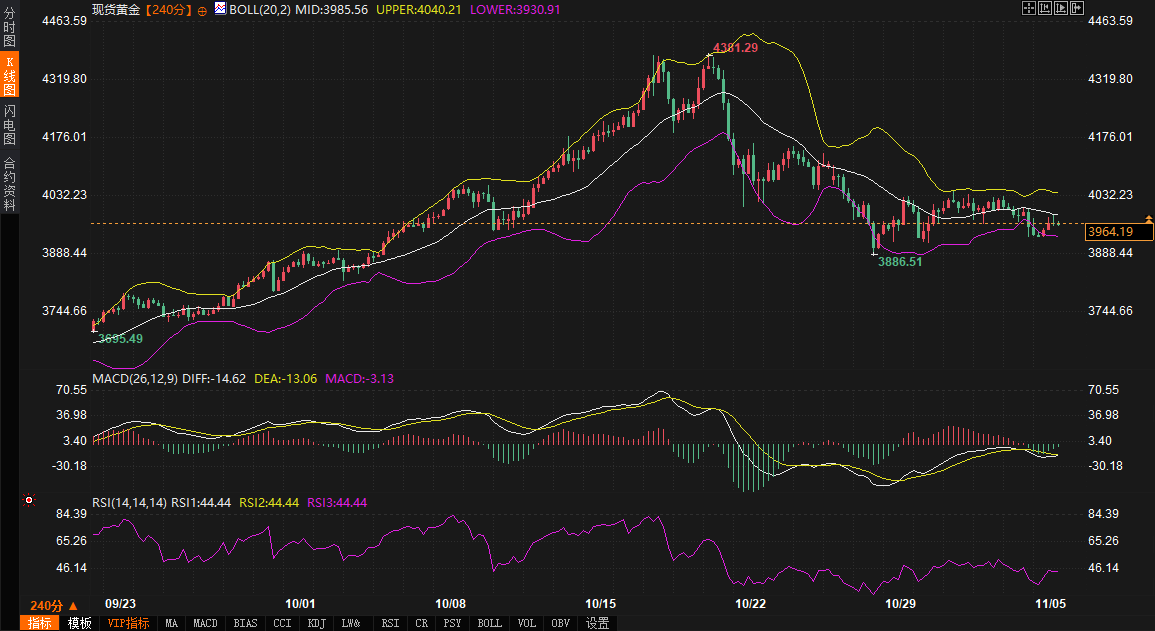
In the spot gold market, the 240-minute chart shows the price below the Bollinger Band middle line at 3985.55. The MACD remains in negative territory, but the RSI has fallen to 44.40, nearing oversold territory, suggesting that rebound momentum is building. If the gold price can hold the lower Bollinger Band support at 3930.85, it may test the upper Bollinger Band at 4040. This technical situation is consistent with the downward trend in medium- and long-term US Treasury yields, indicating that safe-haven funds are flowing into both the bond and gold markets simultaneously.
Overall, technical indicators and fundamental expectations corroborate each other, pointing to a continuation of the steepening curve.
The "soft landing" expectation foreshadowed by the US Treasury yield curve has already spread to the foreign exchange and commodity markets.
A steepening yield curve reinforces pricing in future Federal Reserve rate cuts, potentially weakening the dollar's interest rate advantage and putting pressure on the dollar index near the 100 level. Conversely, this is beneficial for non-interest-bearing assets like gold. A decline in the middle of the yield curve implies a lower implied real interest rate, increasing gold's safe-haven appeal. The current gold price of $3964 already reflects this premium.
However, the strength of this correlation depends on future data confirmation. For example, an unexpected decline in the ISM Services PMI would exacerbate concerns about an economic slowdown, potentially pushing up gold prices and depressing the dollar; conversely, strong data would have the opposite effect. Analysts point out that this pattern has historically occurred during curve repair periods: gold typically reflects medium- to long-term expectations first, while the dollar is more influenced by short-term data. Overall, the current environment favors gold in finding opportunities amidst safe-haven and inflation-hedging demand, while the dollar faces the risk of a pullback from its highs.
Looking ahead, the US Treasury yield curve is expected to maintain its bullish, steepening pattern. Downward pressure on medium- and long-term yields may ease as data is released, while the upside potential for one-year yields will be limited by the Federal Reserve's hawkish stance.
If the ADP and ISM data meet general expectations, the yield curve slope will remain stable, and market focus will shift to the details of refinancing plans. Any unexpected data could amplify the steepness of the curve and increase market volatility. In the long term, with the December FOMC meeting approaching, this curve shape may pave the way for a future rate-cutting cycle, and the "soft landing" narrative will continue to dominate the market. During this process, the correlation between the US dollar and gold will become clearer: the US dollar may weaken amid volatility, while gold will accumulate upward momentum with the help of safe-haven demand.
Subtle shift in curve shape: strengthening expectations of a soft landing
The shifts in the US Treasury yield curve clearly reflect the market's tiered expectations for the US economy. The slight rise in the one-year yield stems from recent resilient employment and inflation data, leading traders to believe the Federal Reserve will not rush to cut interest rates in the short term, thus avoiding the immediate risk of a hard landing. Meanwhile, the decline in yields for maturities of two years and beyond indicates that investors are more cautious about the medium-term outlook: while short-term economic momentum is solid, the growth path over two to ten years may slow, while inflationary pressures are expected to gradually subside.
This expectation is supported by solid fundamentals. The Federal Reserve's maintenance of high interest rates has effectively anchored short-term yields; meanwhile, the continued recovery of global supply chains and the stabilization of geopolitical situations have also mitigated the tail risks of long-term inflation. Some institutions point out that the current yield curve shape is similar to the adjustment phase in mid-2024, when the market also reached a consensus on a "soft landing" amidst data tug-of-war. Going forward, key macroeconomic data will be the decisive factor: if ADP employment data is stronger than expected, it will solidify short-term economic resilience; conversely, if the ISM services PMI falls below the 50-point threshold, it will exacerbate concerns about the medium- to long-term economy and may further steepen the yield curve. While the Treasury's refinancing announcement was not unexpected, its scale and maturity structure will still affect the market's assessment of debt sustainability. If it leans towards long-term bond issuance, it may raise concerns about future supply pressures.
A Fusion Perspective on Technical Signals: Directional Hints Emerging
From a technical perspective, the trends of US Treasury bonds, the US dollar, and gold together construct a coherent market narrative.
The US dollar index is hovering around the middle Bollinger Band at 99.93 on the 240-minute chart. The MACD indicator shows a slight divergence, but the RSI has risen to 67.20, indicating that while short-term momentum has slowed, the overall trend remains sideways, and it has not yet effectively tested the upper Bollinger Band resistance at 100.32. This echoes the firmness of short-term US Treasury yields.
In the spot gold market, the 240-minute chart shows the price below the Bollinger Band middle line at 3985.55. The MACD remains in negative territory, but the RSI has fallen to 44.40, nearing oversold territory, suggesting that rebound momentum is building. If the gold price can hold the lower Bollinger Band support at 3930.85, it may test the upper Bollinger Band at 4040. This technical situation is consistent with the downward trend in medium- and long-term US Treasury yields, indicating that safe-haven funds are flowing into both the bond and gold markets simultaneously.
Overall, technical indicators and fundamental expectations corroborate each other, pointing to a continuation of the steepening curve.
Spillover effects of changing expectations: the correlation between gold and the US dollar
The "soft landing" expectation foreshadowed by the US Treasury yield curve has already spread to the foreign exchange and commodity markets.
A steepening yield curve reinforces pricing in future Federal Reserve rate cuts, potentially weakening the dollar's interest rate advantage and putting pressure on the dollar index near the 100 level. Conversely, this is beneficial for non-interest-bearing assets like gold. A decline in the middle of the yield curve implies a lower implied real interest rate, increasing gold's safe-haven appeal. The current gold price of $3964 already reflects this premium.
However, the strength of this correlation depends on future data confirmation. For example, an unexpected decline in the ISM Services PMI would exacerbate concerns about an economic slowdown, potentially pushing up gold prices and depressing the dollar; conversely, strong data would have the opposite effect. Analysts point out that this pattern has historically occurred during curve repair periods: gold typically reflects medium- to long-term expectations first, while the dollar is more influenced by short-term data. Overall, the current environment favors gold in finding opportunities amidst safe-haven and inflation-hedging demand, while the dollar faces the risk of a pullback from its highs.
Outlook: Potential Paths for Curve Evolution
Looking ahead, the US Treasury yield curve is expected to maintain its bullish, steepening pattern. Downward pressure on medium- and long-term yields may ease as data is released, while the upside potential for one-year yields will be limited by the Federal Reserve's hawkish stance.
If the ADP and ISM data meet general expectations, the yield curve slope will remain stable, and market focus will shift to the details of refinancing plans. Any unexpected data could amplify the steepness of the curve and increase market volatility. In the long term, with the December FOMC meeting approaching, this curve shape may pave the way for a future rate-cutting cycle, and the "soft landing" narrative will continue to dominate the market. During this process, the correlation between the US dollar and gold will become clearer: the US dollar may weaken amid volatility, while gold will accumulate upward momentum with the help of safe-haven demand.
- Risk Warning and Disclaimer
- The market involves risk, and trading may not be suitable for all investors. This article is for reference only and does not constitute personal investment advice, nor does it take into account certain users’ specific investment objectives, financial situation, or other needs. Any investment decisions made based on this information are at your own risk.