Why did gold break out against the trend after the US shutdown crisis ended?
2025-11-10 20:54:38
On Monday evening (November 10), global financial markets experienced structural divergence. As the US Senate advanced a solution to the government shutdown crisis, market risk sentiment improved, while the fixed-income market faced pressure. Spot gold, as a safe-haven asset, demonstrated resilience amid bond market volatility. The US dollar index dipped slightly by 0.02% to 99.5283, the 10-year US Treasury yield rose 0.85% to 4.132%, and spot gold rose 2.31% to $4093.84 per ounce. This pattern reflects the initial easing of US political uncertainty and the subtle impact of Middle East geopolitical risks (such as the proposed Gaza hostage exchange). Overall market sentiment shifted from cautious to mildly optimistic, but changes in the bond market have begun to influence the short-term trends of exchange rates and precious metals.

Rising risk appetite is putting pressure on US Treasuries, which in turn affects the dollar and gold through yield curves. The market generally believes that the easing of the government shutdown crisis not only eliminated fiscal uncertainty but also provided the Federal Reserve with more room for monetary policy. However, this also means that the bond market may find it difficult to return to a low-yield environment in the short term.
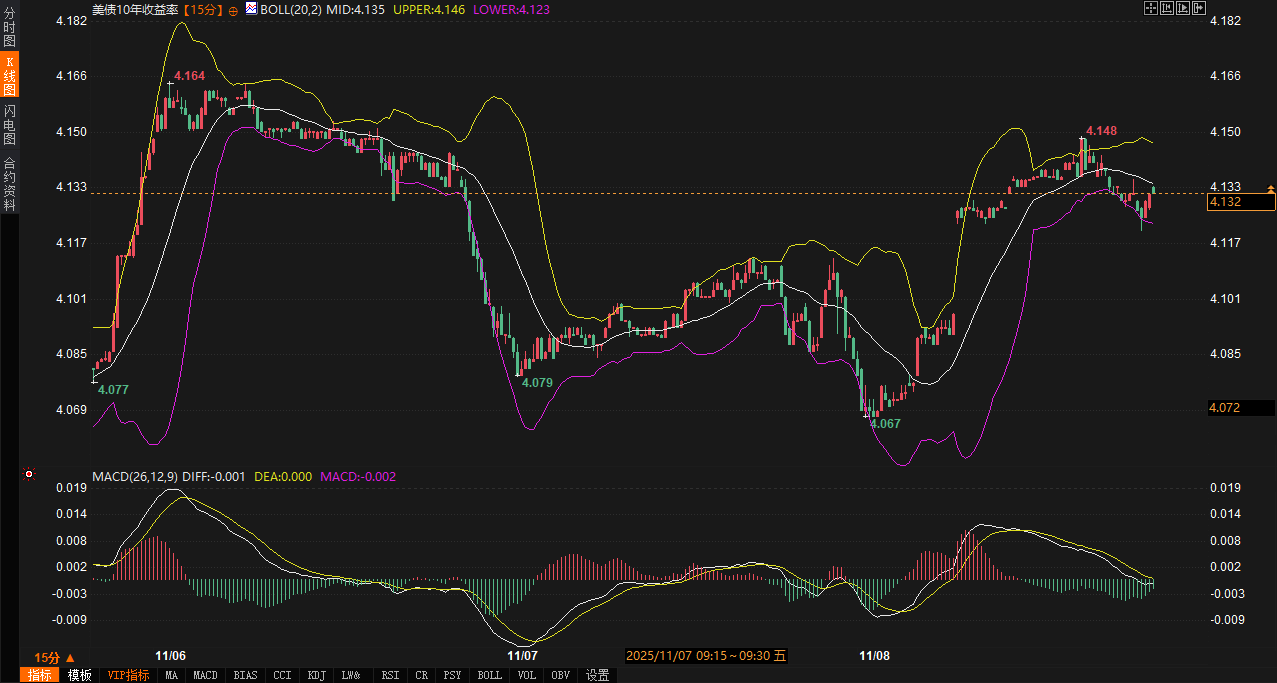
The rebound in 10-year US Treasury yields is a result of both political progress and market liquidity. On Monday morning, news of progress in the Senate on a temporary spending bill put pressure on Treasury futures, with yields rising more than 8 basis points from their lows to 4.132%. The Bollinger Bands (20-period, 2-standard deviation) show the middle band at 4.139%, the upper band at 4.146%, and the lower band at 4.132%. The current yield is near the lower band, indicating limited downside potential in the short term, but bullish momentum is emerging near the upper band. In the MACD indicator (26-fast line, 12-slow line, 9-signal line), the DIFF line is 0.002 and the DEA line is 0.004, both above the zero line. While the histogram does not show significant expansion, it indicates that bullish strength is accumulating.
Fundamentally, the easing of the US government shutdown crisis was the main driver of the yield rebound. The stalemate over the weekend had triggered liquidity concerns, but Monday's developments reversed this, prompting selling in the bond market. Increased trading volume—with 10-year futures exceeding 300,000 contracts in early trading—indicates that institutional funds are adjusting their positions to capitalize on rising yields after political risks subsided. Geopolitical developments in Gaza (such as the proposed hostage exchange) also indirectly affect bond pricing; their uncertainty may increase demand for US Treasuries in the short term, but this is more of amplifying volatility than driving the overall direction.
Technical and fundamental factors corroborate each other. Yields have found key support at the lower Bollinger Band at 4.132%. If positive political news continues, it could push yields back towards the middle band at 4.139%. If the MACD fast and slow lines form a golden cross, yields may further test the upper band at 4.146%, reinforcing the hawkish signal in the bond market. Conversely, if negotiations drag on, a break below the lower band could cause yields to fall back to around 4.120%, but given the active trading, the downside is limited. Overall, the adjustment in US Treasury yields reflects the immediate impact of political events and provides clues to the dollar's trajectory—rising yields may suppress the dollar's attractiveness through interest rate differentials.
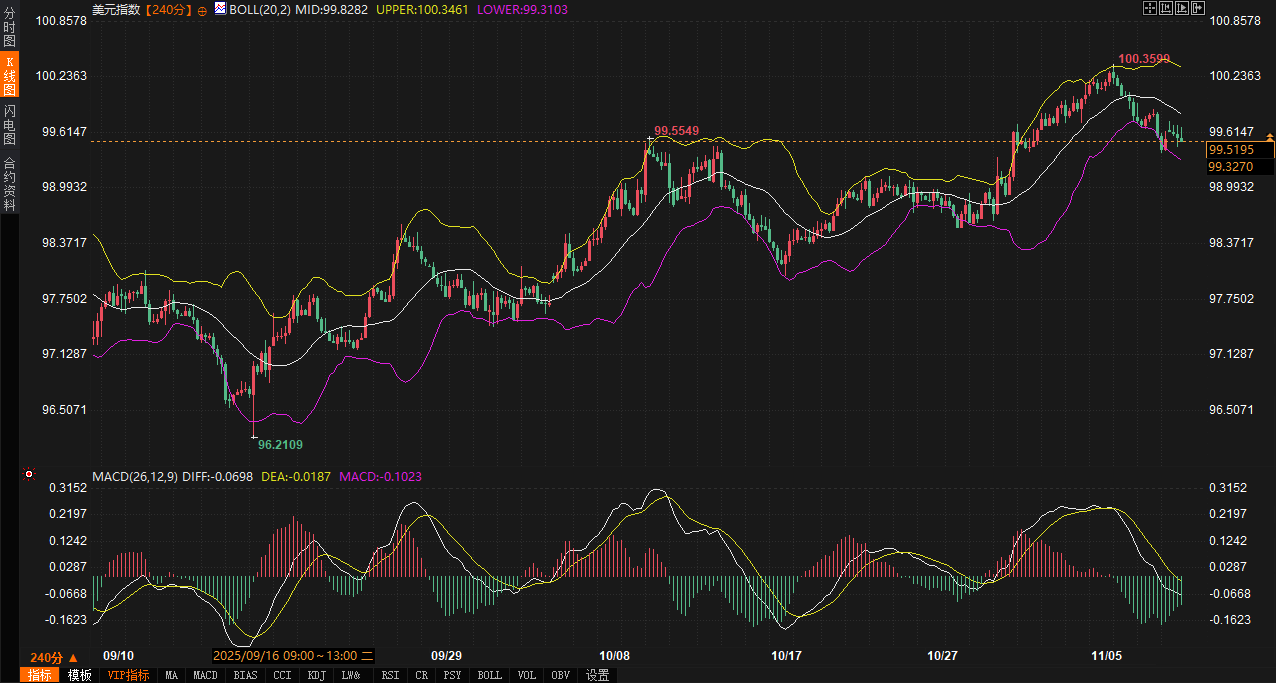
The US dollar index fell slightly by 0.02% to 99.5283, mainly driven by signals from the bond market. Traditionally, the dollar and US Treasury yields are positively correlated, but Monday's improved risk appetite and asymmetrical pressure on the bond market led to a divergence in their movements. The Bollinger Bands' middle band is at 99.8285, the upper band at 100.3456, and the lower band at 99.3121. The index is currently in the lower half, indicating range-bound trading. The MACD indicator's DIFF is -0.0691 and DEA is -0.0186, both below the zero line. The contraction of the histogram suggests that bearish momentum has eased, but a clear reversal has not yet occurred.
Fundamentally, the rebound in US Treasury yields is the core factor driving the dollar's movements. The easing of the government shutdown crisis boosted risk assets, leading to capital outflows from the dollar, with the dollar index rising to 99.64 before retreating. This indicates that while rising yields support the dollar's fundamentals, risk appetite driven by political optimism has weakened safe-haven demand. The relatively stable exchange rates of the yen, euro, and pound sterling further reflect the dollar's weakness. Geopolitical uncertainty surrounding the proposed Gaza hostage exchange indirectly amplifies dollar volatility through the bond market; if progress is smooth, this could further contribute to a downward shift in the dollar's value.
Technically, the US dollar index is trading between 99.3121 and 100.3456, based on the upper and lower Bollinger Bands. Currently, the index is near the lower edge of the middle band. If yields continue to rise, the DIFF line may test the zero line and rebound, supporting the dollar's stabilization around 99.5000. Conversely, the lower band at 99.3121 becomes a key defense level; a break below this level could lead to a test of 99.2000. The market is watching the MACD histogram closely. If the bearish bars shorten and trading volume increases moderately, the dollar may bottom out at the lower band and rebound towards the upper band. The market expects this consolidation to continue until the government shutdown plan is finalized, and bond market signals will be a key indicator of the dollar's short-term trend.
Traders and analysts point out that the rebound in US Treasury yields is eroding the safe-haven premium of the dollar, especially against the backdrop of receding political risks. The indirect impact of Gaza developments on the bond market also adds complexity to the dollar's trajectory. Overall, the dollar's minor adjustment is not a directional shift, but rather a tactical adjustment driven by the bond market; the amplifying effect of a yield channel breakout on the exchange rate should be closely monitored.
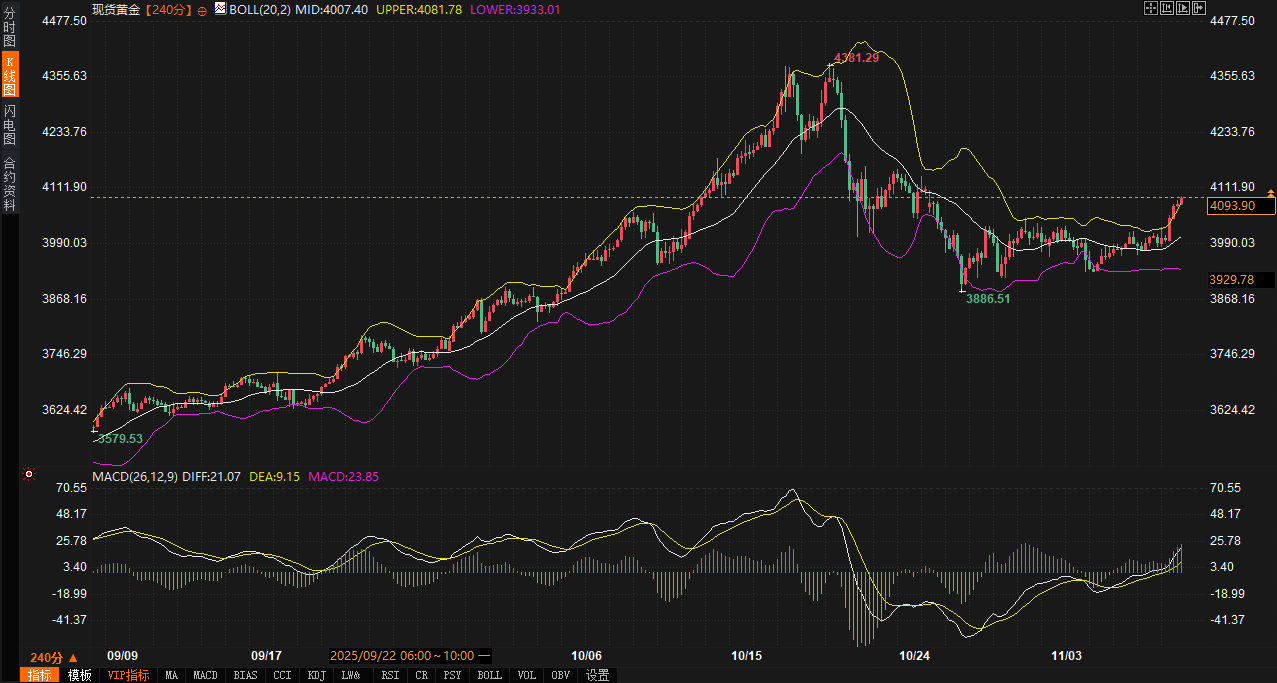
Spot gold rose 2.31% to $4093.84 per ounce, demonstrating its safe-haven resilience amid bond market volatility. While rising US Treasury yields typically weigh on non-interest-bearing assets, lingering political uncertainty and geopolitical risks in Gaza have strengthened demand for gold. The price broke through the upper Bollinger Band at $4081.72, located on the outer edge of the channel, indicating strong bullish momentum. The MACD indicator's DIFF rose to 21.09 and DEA to 9.15, both above the zero line, with the histogram bars lengthening, confirming the upward trend.
Fundamentally, the easing of the government shutdown crisis should have suppressed gold, but immediate feedback from bond market pressures reversed this expectation. Selling in US Treasury futures led to a rebound in yields, briefly squeezing gold through opportunity cost channels, but developments in the Gaza geopolitical situation (such as the proposed hostage exchange) quickly ignited safe-haven demand. While this plan aims to ease tensions, its uncertainty may prolong the allocation of funds to gold. A slight rise in oil prices to $59.87 per barrel also indirectly supported gold's inflation hedge properties. Feedback from commodity traders indicates that bond market volatility is shifting safe-haven demand from the US dollar to gold, consistent with the price breaking through the upper Bollinger Band.
The combination of technical and fundamental factors has strengthened the short-term upward momentum for gold. The support and resistance zone is between 4007.40 and 4130.00, with the Bollinger Band middle line at 4007.40 acting as lower support and 4130.00 as upper resistance. If the yield tests the upper Bollinger Band at 4.146%, gold may face opportunity cost pressure and retrace to the middle line at 4007.40; however, the MACD golden cross indicates solid lower support, and if the price holds above 4081.72, it may further test 4130.00. Moderate trading volume reduces the risk of a pullback, ensuring the trend's sustainability. This range prediction is based on technical channels and the transmission effect from the bond market—rising yields may increase the relative attractiveness of gold.
Over the next 2-3 days, US Treasury yields are likely to fluctuate at high levels within the 4.132%-4.146% range, with the final outcome of the government shutdown plan being crucial. If things proceed smoothly, the 4.139% mid-range yield could become a new anchor point, pushing the bond market towards a hawkish stance. The US dollar index is expected to trade within a channel of 99.3121-100.3456, with the strength of bond market signals determining the effectiveness of the lower support level. Downside potential is limited, but caution is advised regarding amplified external risks. Spot gold is expected to consolidate its upward momentum within the 4007.40-4130.00 range, with the safe-haven effect transmitted from the bond market potentially amplifying its momentum. If the Gaza swap plan triggers new uncertainties, a price pullback to the mid-range may only be a temporary correction.
Rising risk appetite is putting pressure on US Treasuries, which in turn affects the dollar and gold through yield curves. The market generally believes that the easing of the government shutdown crisis not only eliminated fiscal uncertainty but also provided the Federal Reserve with more room for monetary policy. However, this also means that the bond market may find it difficult to return to a low-yield environment in the short term.
US Treasury yields rebound: the combined effect of political developments and market liquidity.
The rebound in 10-year US Treasury yields is a result of both political progress and market liquidity. On Monday morning, news of progress in the Senate on a temporary spending bill put pressure on Treasury futures, with yields rising more than 8 basis points from their lows to 4.132%. The Bollinger Bands (20-period, 2-standard deviation) show the middle band at 4.139%, the upper band at 4.146%, and the lower band at 4.132%. The current yield is near the lower band, indicating limited downside potential in the short term, but bullish momentum is emerging near the upper band. In the MACD indicator (26-fast line, 12-slow line, 9-signal line), the DIFF line is 0.002 and the DEA line is 0.004, both above the zero line. While the histogram does not show significant expansion, it indicates that bullish strength is accumulating.
Fundamentally, the easing of the US government shutdown crisis was the main driver of the yield rebound. The stalemate over the weekend had triggered liquidity concerns, but Monday's developments reversed this, prompting selling in the bond market. Increased trading volume—with 10-year futures exceeding 300,000 contracts in early trading—indicates that institutional funds are adjusting their positions to capitalize on rising yields after political risks subsided. Geopolitical developments in Gaza (such as the proposed hostage exchange) also indirectly affect bond pricing; their uncertainty may increase demand for US Treasuries in the short term, but this is more of amplifying volatility than driving the overall direction.
Technical and fundamental factors corroborate each other. Yields have found key support at the lower Bollinger Band at 4.132%. If positive political news continues, it could push yields back towards the middle band at 4.139%. If the MACD fast and slow lines form a golden cross, yields may further test the upper band at 4.146%, reinforcing the hawkish signal in the bond market. Conversely, if negotiations drag on, a break below the lower band could cause yields to fall back to around 4.120%, but given the active trading, the downside is limited. Overall, the adjustment in US Treasury yields reflects the immediate impact of political events and provides clues to the dollar's trajectory—rising yields may suppress the dollar's attractiveness through interest rate differentials.
US Dollar Index Slight Adjustment: Bond Market-Driven Range-Bound Trading
The US dollar index fell slightly by 0.02% to 99.5283, mainly driven by signals from the bond market. Traditionally, the dollar and US Treasury yields are positively correlated, but Monday's improved risk appetite and asymmetrical pressure on the bond market led to a divergence in their movements. The Bollinger Bands' middle band is at 99.8285, the upper band at 100.3456, and the lower band at 99.3121. The index is currently in the lower half, indicating range-bound trading. The MACD indicator's DIFF is -0.0691 and DEA is -0.0186, both below the zero line. The contraction of the histogram suggests that bearish momentum has eased, but a clear reversal has not yet occurred.
Fundamentally, the rebound in US Treasury yields is the core factor driving the dollar's movements. The easing of the government shutdown crisis boosted risk assets, leading to capital outflows from the dollar, with the dollar index rising to 99.64 before retreating. This indicates that while rising yields support the dollar's fundamentals, risk appetite driven by political optimism has weakened safe-haven demand. The relatively stable exchange rates of the yen, euro, and pound sterling further reflect the dollar's weakness. Geopolitical uncertainty surrounding the proposed Gaza hostage exchange indirectly amplifies dollar volatility through the bond market; if progress is smooth, this could further contribute to a downward shift in the dollar's value.
Technically, the US dollar index is trading between 99.3121 and 100.3456, based on the upper and lower Bollinger Bands. Currently, the index is near the lower edge of the middle band. If yields continue to rise, the DIFF line may test the zero line and rebound, supporting the dollar's stabilization around 99.5000. Conversely, the lower band at 99.3121 becomes a key defense level; a break below this level could lead to a test of 99.2000. The market is watching the MACD histogram closely. If the bearish bars shorten and trading volume increases moderately, the dollar may bottom out at the lower band and rebound towards the upper band. The market expects this consolidation to continue until the government shutdown plan is finalized, and bond market signals will be a key indicator of the dollar's short-term trend.
Traders and analysts point out that the rebound in US Treasury yields is eroding the safe-haven premium of the dollar, especially against the backdrop of receding political risks. The indirect impact of Gaza developments on the bond market also adds complexity to the dollar's trajectory. Overall, the dollar's minor adjustment is not a directional shift, but rather a tactical adjustment driven by the bond market; the amplifying effect of a yield channel breakout on the exchange rate should be closely monitored.
Gold's upward momentum: a combination of bond market transmission and safe-haven demand.
Spot gold rose 2.31% to $4093.84 per ounce, demonstrating its safe-haven resilience amid bond market volatility. While rising US Treasury yields typically weigh on non-interest-bearing assets, lingering political uncertainty and geopolitical risks in Gaza have strengthened demand for gold. The price broke through the upper Bollinger Band at $4081.72, located on the outer edge of the channel, indicating strong bullish momentum. The MACD indicator's DIFF rose to 21.09 and DEA to 9.15, both above the zero line, with the histogram bars lengthening, confirming the upward trend.
Fundamentally, the easing of the government shutdown crisis should have suppressed gold, but immediate feedback from bond market pressures reversed this expectation. Selling in US Treasury futures led to a rebound in yields, briefly squeezing gold through opportunity cost channels, but developments in the Gaza geopolitical situation (such as the proposed hostage exchange) quickly ignited safe-haven demand. While this plan aims to ease tensions, its uncertainty may prolong the allocation of funds to gold. A slight rise in oil prices to $59.87 per barrel also indirectly supported gold's inflation hedge properties. Feedback from commodity traders indicates that bond market volatility is shifting safe-haven demand from the US dollar to gold, consistent with the price breaking through the upper Bollinger Band.
The combination of technical and fundamental factors has strengthened the short-term upward momentum for gold. The support and resistance zone is between 4007.40 and 4130.00, with the Bollinger Band middle line at 4007.40 acting as lower support and 4130.00 as upper resistance. If the yield tests the upper Bollinger Band at 4.146%, gold may face opportunity cost pressure and retrace to the middle line at 4007.40; however, the MACD golden cross indicates solid lower support, and if the price holds above 4081.72, it may further test 4130.00. Moderate trading volume reduces the risk of a pullback, ensuring the trend's sustainability. This range prediction is based on technical channels and the transmission effect from the bond market—rising yields may increase the relative attractiveness of gold.
Outlook for the next 2-3 days: A volatile equilibrium dominated by the bond market.
Over the next 2-3 days, US Treasury yields are likely to fluctuate at high levels within the 4.132%-4.146% range, with the final outcome of the government shutdown plan being crucial. If things proceed smoothly, the 4.139% mid-range yield could become a new anchor point, pushing the bond market towards a hawkish stance. The US dollar index is expected to trade within a channel of 99.3121-100.3456, with the strength of bond market signals determining the effectiveness of the lower support level. Downside potential is limited, but caution is advised regarding amplified external risks. Spot gold is expected to consolidate its upward momentum within the 4007.40-4130.00 range, with the safe-haven effect transmitted from the bond market potentially amplifying its momentum. If the Gaza swap plan triggers new uncertainties, a price pullback to the mid-range may only be a temporary correction.
- Risk Warning and Disclaimer
- The market involves risk, and trading may not be suitable for all investors. This article is for reference only and does not constitute personal investment advice, nor does it take into account certain users’ specific investment objectives, financial situation, or other needs. Any investment decisions made based on this information are at your own risk.