A comprehensive preview of the non-farm payrolls report in eight charts; the first non-farm payrolls report after the White House shutdown is likely to be poor.
2025-12-16 12:03:37
The first non-farm payroll report since the White House shutdown will be released tonight. The highly anticipated US October-November non-farm payroll report will be released at 21:30 Beijing time on Tuesday (December 16, 2025). Because the White House shutdown prevented the separate calculation of the October non-farm payroll report, the October data will be included in the November non-farm payroll report, which some media outlets refer to as the November non-farm payroll report.
[This article features eight original charts, providing you with the most comprehensive preview of the non-farm payrolls report. The first non-farm payrolls report after the White House shutdown is likely to be poor.]
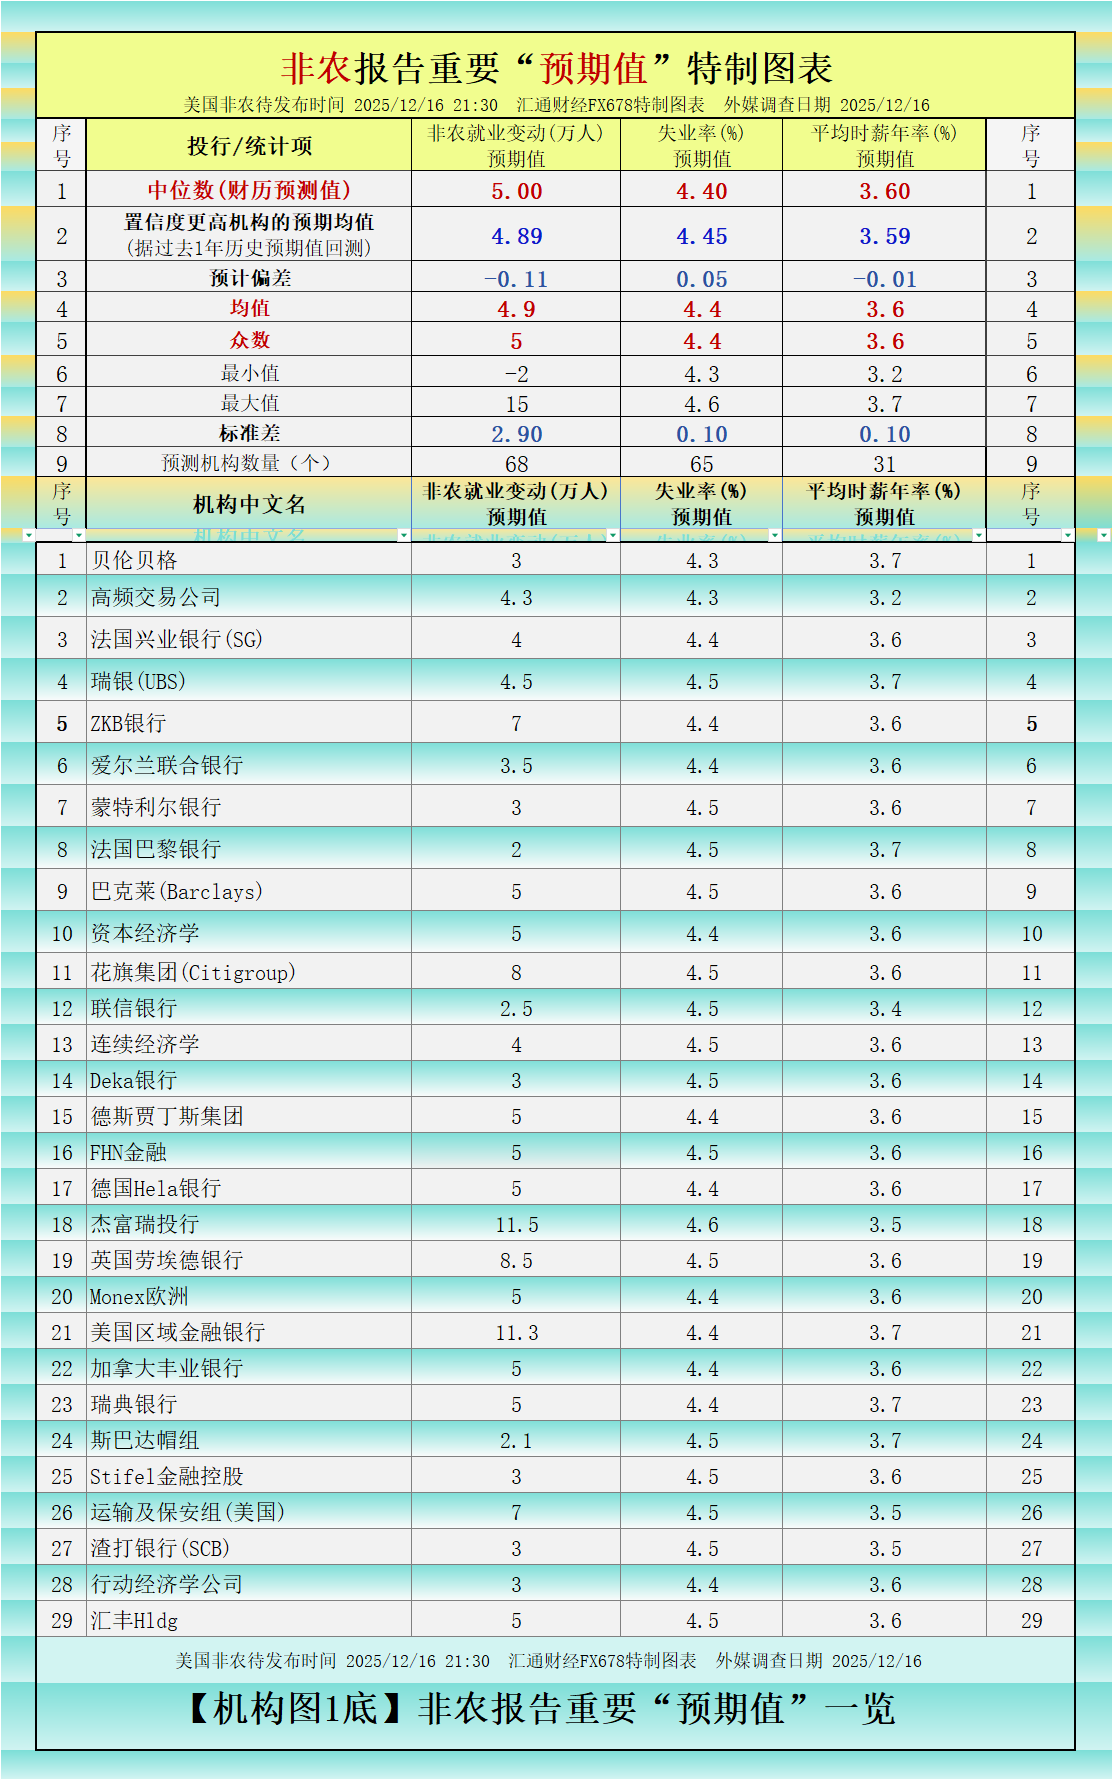
According to forecasts from over 67 internationally renowned investment banks and financial experts, the expected changes in non-farm payrolls are: an increase of 50,000, an unemployment rate of 4.4%, and an annualized average hourly wage growth of 3.6%.
Figure 1 shows a "Smarter" forecast for non-farm payrolls: an increase of 48,900, suggesting that non-farm payrolls may be lower than 50,000. Figure 8 shows some of the latest "leading indicators for non-farm payrolls," which suggest mixed results.
The specially designed charts in this article show the expected data of each institution, as well as the expected mean, mode, maximum, minimum, and prediction intervals for three confidence levels calculated based on the survey results. See the table below for details.
As shown in Figure 1 above, a total of 29 institutions/experts have given expected values for all three indicators.
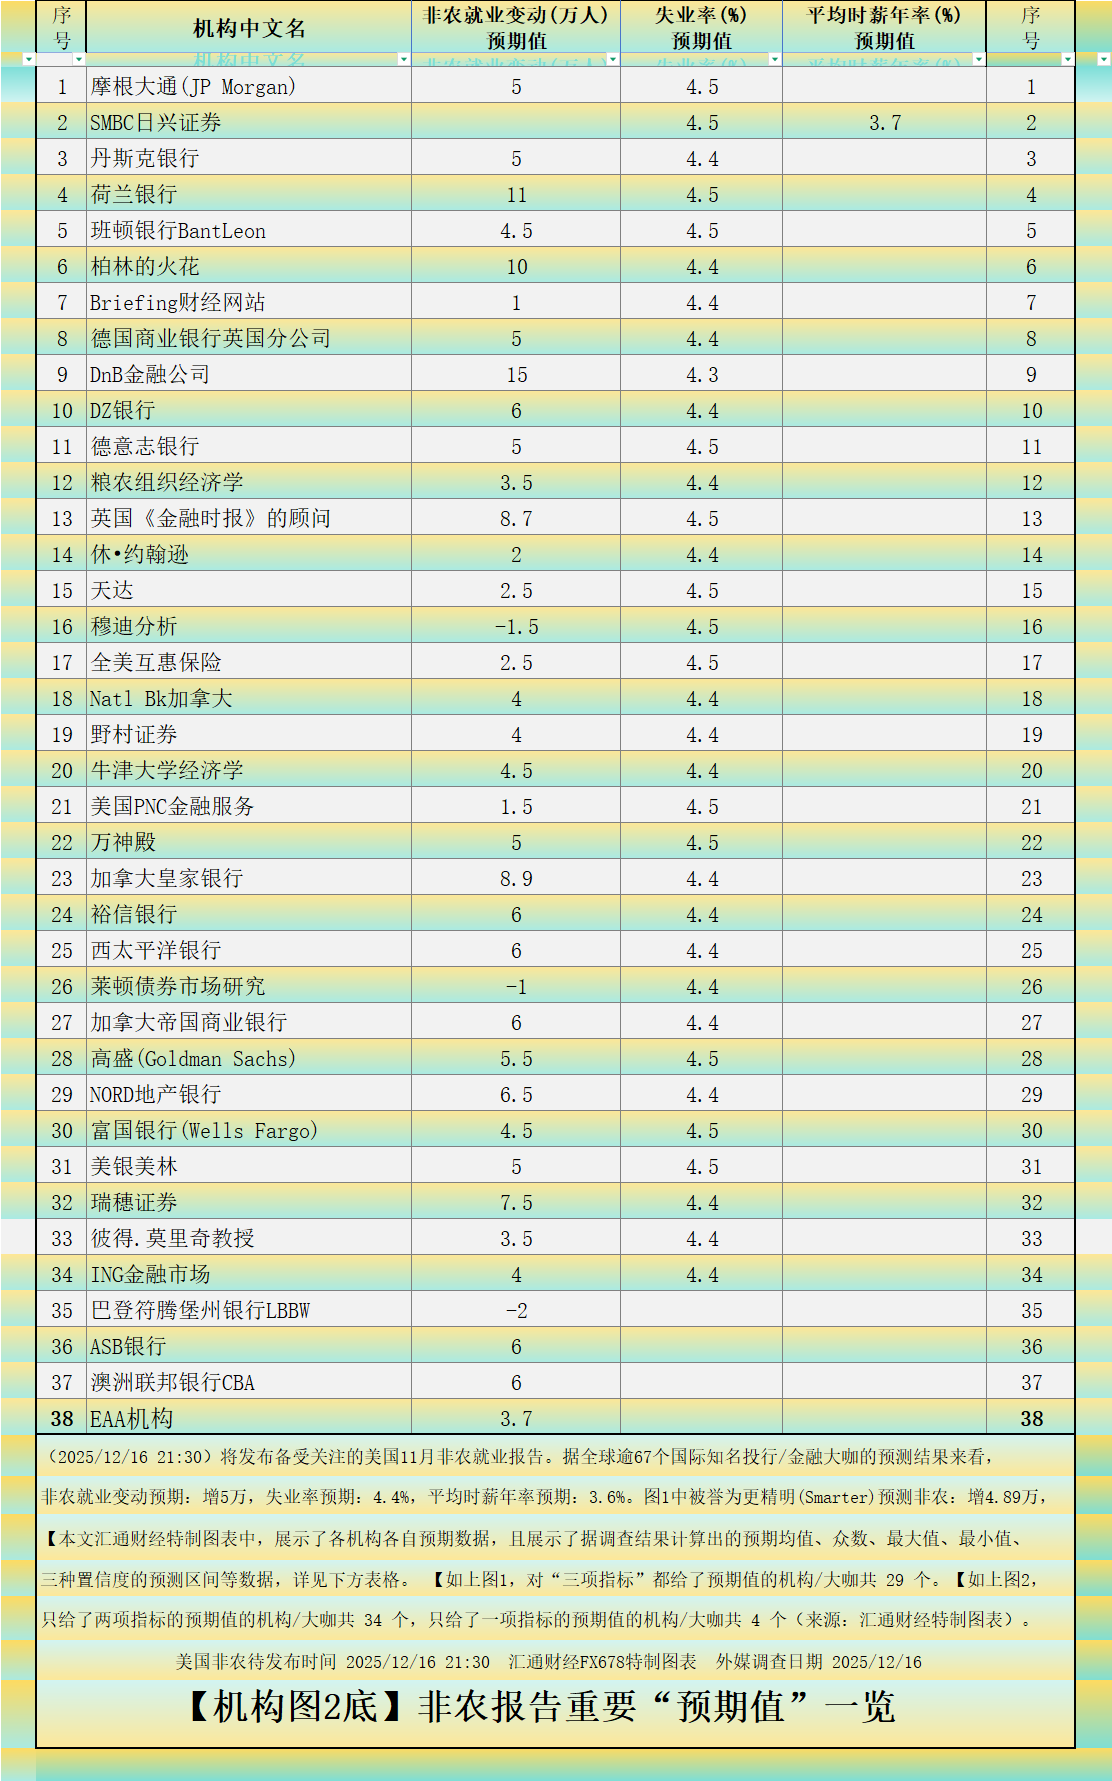
As shown in Figure 2 above, there are 34 institutions/experts that only provide expected values for two indicators , and 4 institutions/experts that only provide expected values for one indicator (Source: FX678 Special Chart).
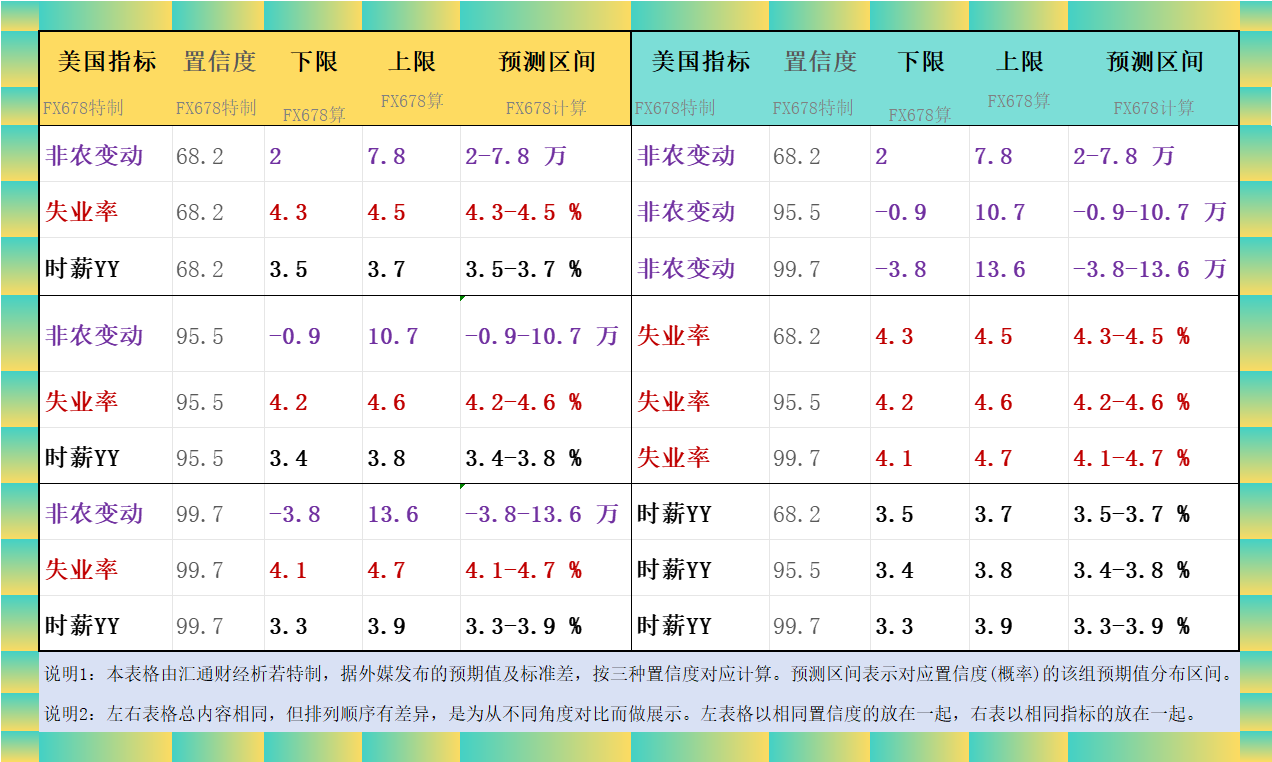
[As shown in Figure 3 below, based on the principle of normal distribution , we can calculate the expected intervals corresponding to confidence levels of 68.2%, 95.5%, and 99.7%, as follows.]
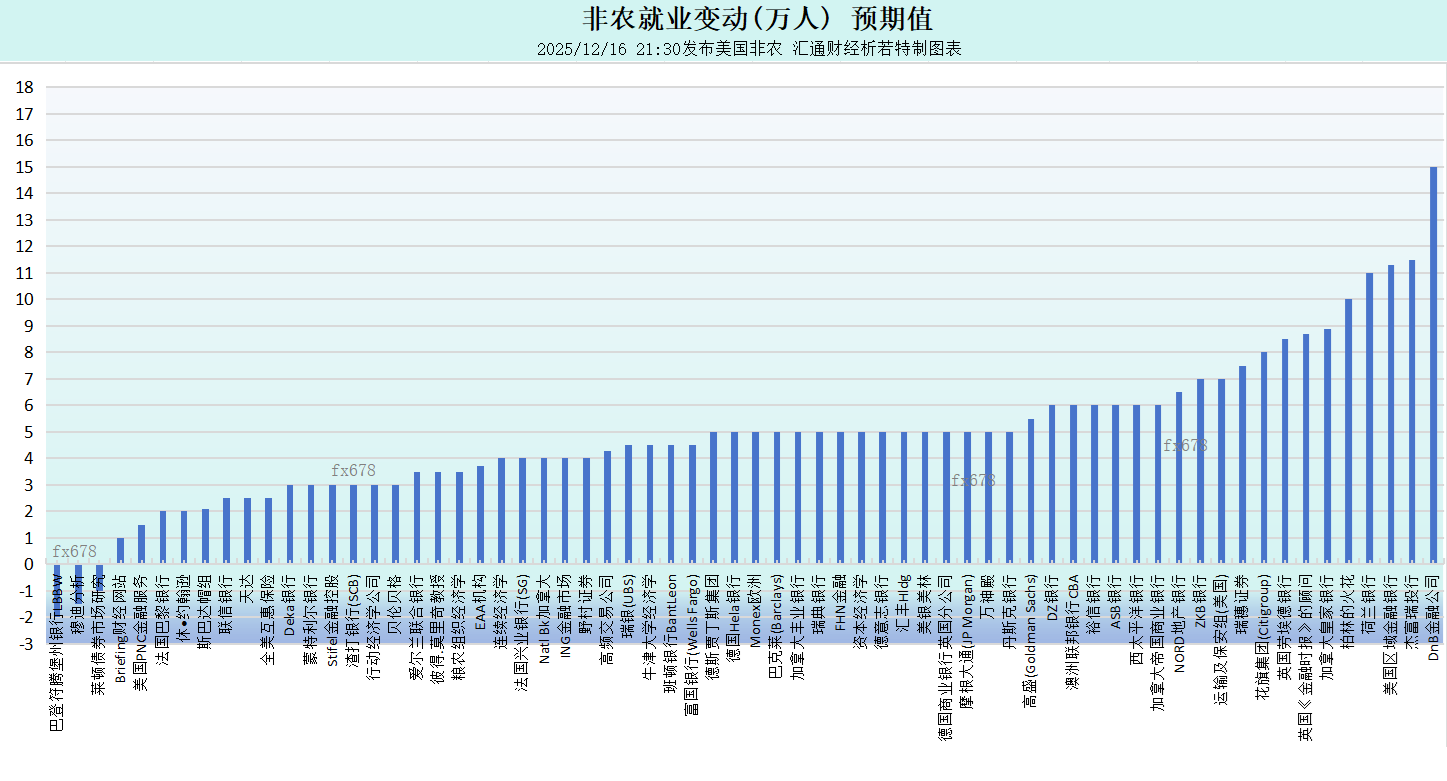
[Figure 4 below: Overview of institutional expectations for non-farm payroll changes:]
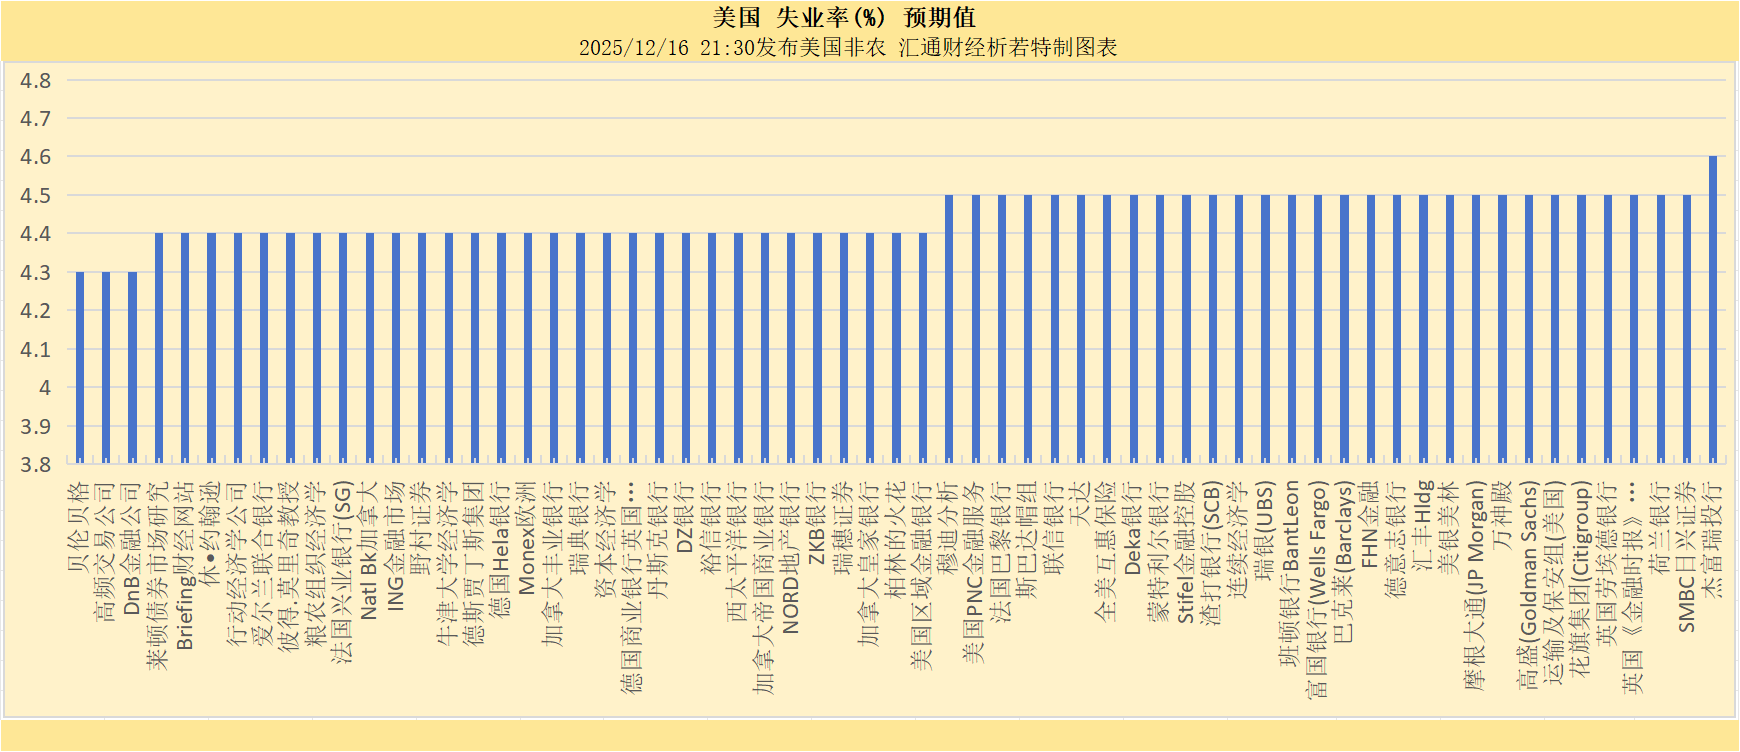
[Figure 5 below: A summary of institutional expectations for the unemployment rate:]
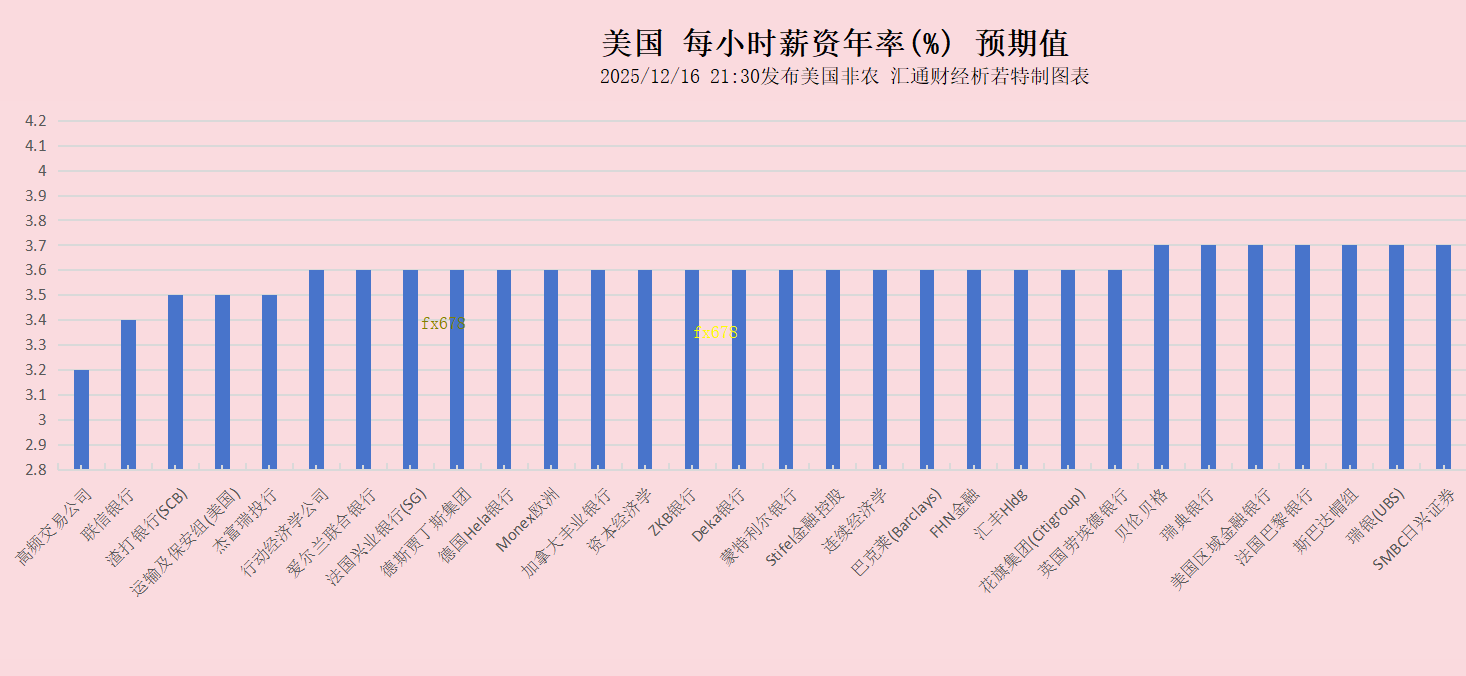
[Figure 6 below: Overview of various institutions' expectations for annual salary rates:]
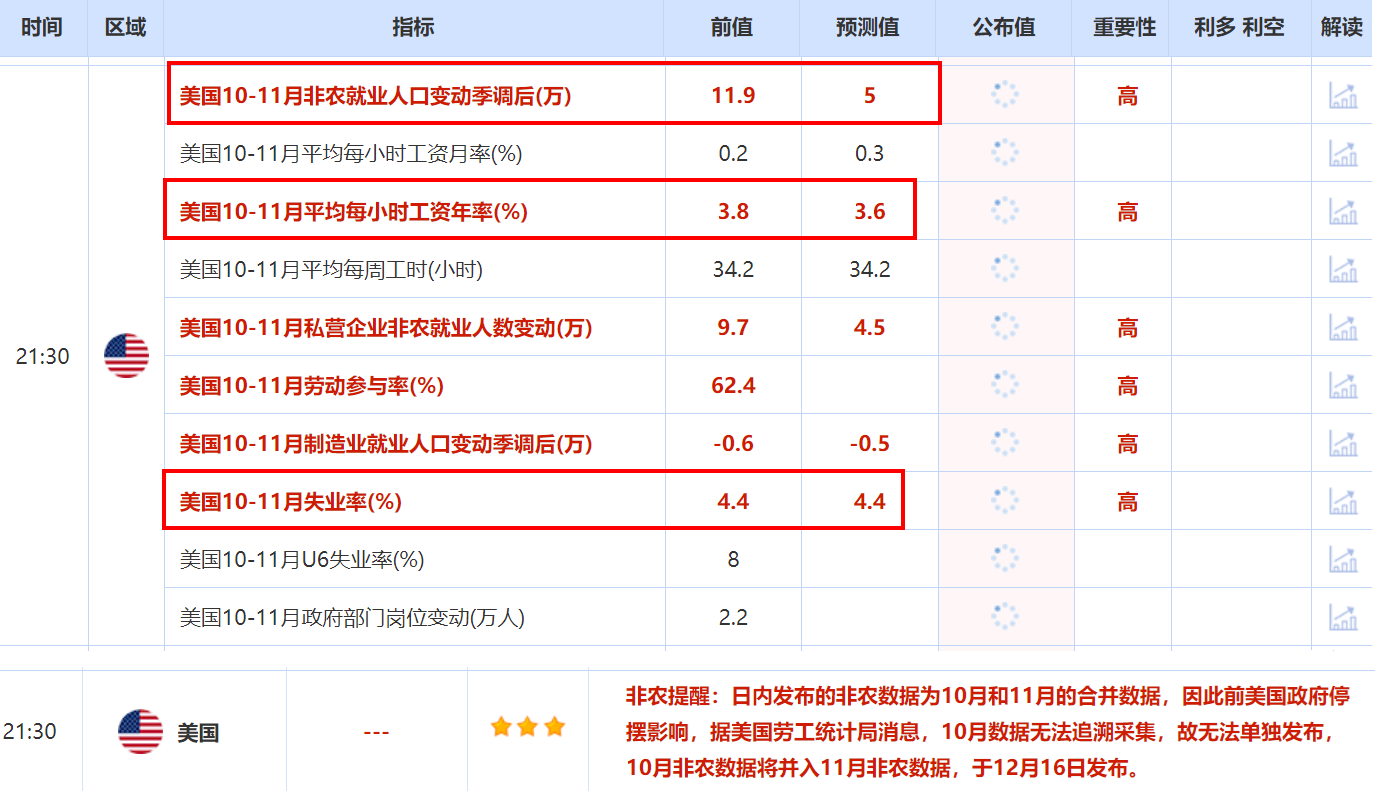
[Figure 7 below shows the details of tonight's non-farm payrolls report and its sub-items on the economic calendar page:]
[Figure 8 below shows the latest US "Non-Farm Leading Indicator" released from December 1-4 , which generally suggests that the US job market is mixed (see FX678 Non-Farm Payroll Special Report for more details).]

It's important to note that even the most authoritative institutions can make inaccurate predictions. There have been instances where non-farm payroll results were stronger than the strongest expectations, and instances where the released figures were weaker than any institution's forecast. However, market investors base their strategies on these predictions, and the market's reaction is influenced by these expected values, affecting both bullish and bearish adjustments and market sentiment. Therefore, studying the predicted values in advance remains crucial.
This article is an original analysis by FX678 analyst Xiruo, and all rights are reserved. It is for reference only and should not be used as a basis for trading.
[This article features eight original charts, providing you with the most comprehensive preview of the non-farm payrolls report. The first non-farm payrolls report after the White House shutdown is likely to be poor.]
According to forecasts from over 67 internationally renowned investment banks and financial experts, the expected changes in non-farm payrolls are: an increase of 50,000, an unemployment rate of 4.4%, and an annualized average hourly wage growth of 3.6%.
Figure 1 shows a "Smarter" forecast for non-farm payrolls: an increase of 48,900, suggesting that non-farm payrolls may be lower than 50,000. Figure 8 shows some of the latest "leading indicators for non-farm payrolls," which suggest mixed results.
The specially designed charts in this article show the expected data of each institution, as well as the expected mean, mode, maximum, minimum, and prediction intervals for three confidence levels calculated based on the survey results. See the table below for details.
As shown in Figure 1 above, a total of 29 institutions/experts have given expected values for all three indicators.
As shown in Figure 2 above, there are 34 institutions/experts that only provide expected values for two indicators , and 4 institutions/experts that only provide expected values for one indicator (Source: FX678 Special Chart).
[As shown in Figure 3 below, based on the principle of normal distribution , we can calculate the expected intervals corresponding to confidence levels of 68.2%, 95.5%, and 99.7%, as follows.]
[Figure 4 below: Overview of institutional expectations for non-farm payroll changes:]
[Figure 5 below: A summary of institutional expectations for the unemployment rate:]
[Figure 6 below: Overview of various institutions' expectations for annual salary rates:]
[Figure 7 below shows the details of tonight's non-farm payrolls report and its sub-items on the economic calendar page:]
[Figure 8 below shows the latest US "Non-Farm Leading Indicator" released from December 1-4 , which generally suggests that the US job market is mixed (see FX678 Non-Farm Payroll Special Report for more details).]
It's important to note that even the most authoritative institutions can make inaccurate predictions. There have been instances where non-farm payroll results were stronger than the strongest expectations, and instances where the released figures were weaker than any institution's forecast. However, market investors base their strategies on these predictions, and the market's reaction is influenced by these expected values, affecting both bullish and bearish adjustments and market sentiment. Therefore, studying the predicted values in advance remains crucial.
This article is an original analysis by FX678 analyst Xiruo, and all rights are reserved. It is for reference only and should not be used as a basis for trading.
- Risk Warning and Disclaimer
- The market involves risk, and trading may not be suitable for all investors. This article is for reference only and does not constitute personal investment advice, nor does it take into account certain users’ specific investment objectives, financial situation, or other needs. Any investment decisions made based on this information are at your own risk.