With the situation in Venezuela uncertain, WTI crude oil is testing a key resistance level again.
2026-01-07 19:10:11
On Wednesday (January 7), during the European session, the price of US benchmark WTI crude oil remained stuck near a three-week low, having earlier fallen below $56.00, as the unexpected US announcement that it would import crude oil from Venezuela exacerbated market concerns about an oil glut.

US President Donald Trump announced on Tuesday that the United States will import 30 to 50 million barrels of crude oil from Venezuela's previously sanctioned oil reserves. This news increases global crude oil supply, while demand for crude oil is weakening amid economic slowdowns in most major economies worldwide.
Market observers expect global crude oil supply to remain ample in 2026 even without any intervention from OPEC, as production is projected to remain stable while demand is likely to remain weak as most major economies struggle to accelerate economic growth.
From a supply and demand perspective, oil prices will continue to be under pressure (unless there are significant and unexpected changes), but the highly fragile geopolitical situation necessitates continued caution.
Following the announcement of the agreement between the US and Caracas, WTI crude oil prices fell by more than $2, dropping below $57.00 for the first time since mid-December, before rebounding on Wednesday. However, prices remain capped below $56.60 as investors await the release of key US employment data.
Data released by the American Petroleum Institute (API) on Tuesday showed that crude oil inventories fell by 2.8 million barrels in the last week of December, while the market had expected an increase of 12 million barrels.
Furthermore, OPEC+, comprised of most of the world's major oil producers, agreed to maintain current production levels at a brief meeting over the weekend, carefully avoiding any mention of the growing tensions between member countries. However, this decision failed to provide any significant support for oil prices.
Technical Analysis
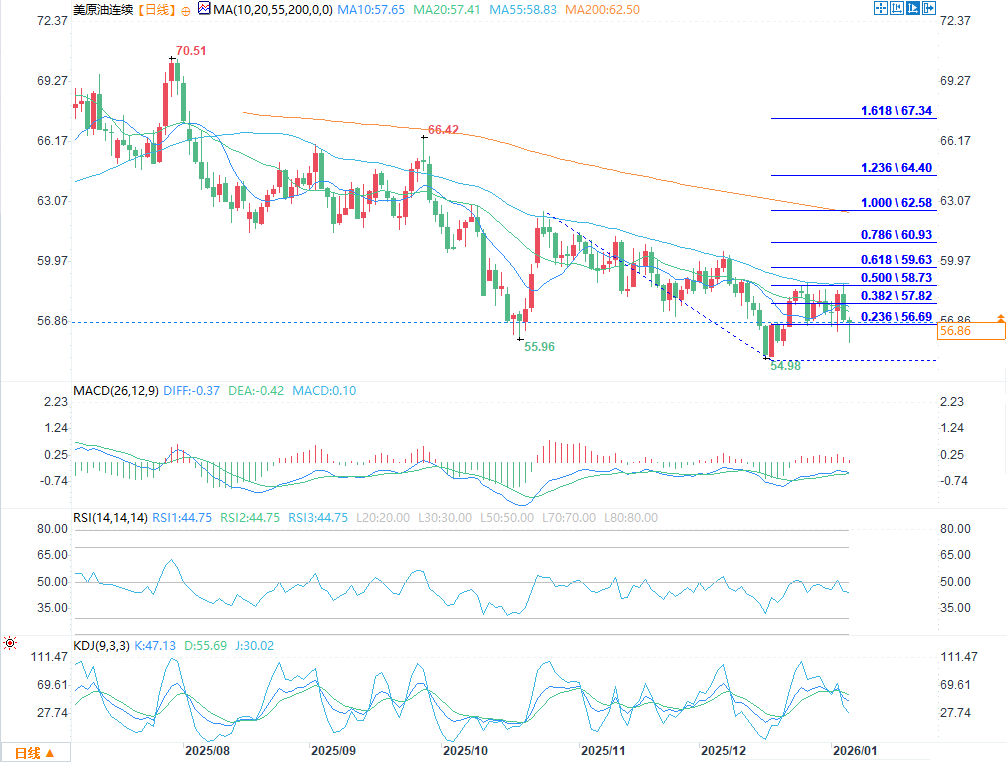
(WTI crude oil daily chart source: FX678)
The technical pattern on the daily chart shows a slight improvement (strengthened positive momentum/golden cross of the 10-day and 20-day moving averages). The key resistance level of $58.72 (the 50% retracement of the $62.58–$54.87 decline, reinforced by the 55-day moving average) is being tested again, but no effective breakout has occurred so far.
If this level fails again and is pressured by the nearby lower-moving daily thick cloud (US$59.39–US$618.18), the short-term outlook will weaken and downside risks will increase, as oil prices remain within their recent consolidation range after repeated attempts to rally from the 2025 low (US$54.87) have been repeatedly suppressed.
However, as long as oil prices hold above $57.82 (the 10-day moving average/the broken 38.2% Fibonacci retracement level), the short-term structure is expected to remain slightly bullish; if it falls below $57.55 (the 20-day moving average), it could trigger a deeper decline.
Resistance levels: 58.80; 59.63; 60.00; 60.48
Support levels: 57.82; 57.55; 57.00; 56.69
US President Donald Trump announced on Tuesday that the United States will import 30 to 50 million barrels of crude oil from Venezuela's previously sanctioned oil reserves. This news increases global crude oil supply, while demand for crude oil is weakening amid economic slowdowns in most major economies worldwide.
Market observers expect global crude oil supply to remain ample in 2026 even without any intervention from OPEC, as production is projected to remain stable while demand is likely to remain weak as most major economies struggle to accelerate economic growth.
From a supply and demand perspective, oil prices will continue to be under pressure (unless there are significant and unexpected changes), but the highly fragile geopolitical situation necessitates continued caution.
Following the announcement of the agreement between the US and Caracas, WTI crude oil prices fell by more than $2, dropping below $57.00 for the first time since mid-December, before rebounding on Wednesday. However, prices remain capped below $56.60 as investors await the release of key US employment data.
Data released by the American Petroleum Institute (API) on Tuesday showed that crude oil inventories fell by 2.8 million barrels in the last week of December, while the market had expected an increase of 12 million barrels.
Furthermore, OPEC+, comprised of most of the world's major oil producers, agreed to maintain current production levels at a brief meeting over the weekend, carefully avoiding any mention of the growing tensions between member countries. However, this decision failed to provide any significant support for oil prices.
Technical Analysis
(WTI crude oil daily chart source: FX678)
The technical pattern on the daily chart shows a slight improvement (strengthened positive momentum/golden cross of the 10-day and 20-day moving averages). The key resistance level of $58.72 (the 50% retracement of the $62.58–$54.87 decline, reinforced by the 55-day moving average) is being tested again, but no effective breakout has occurred so far.
If this level fails again and is pressured by the nearby lower-moving daily thick cloud (US$59.39–US$618.18), the short-term outlook will weaken and downside risks will increase, as oil prices remain within their recent consolidation range after repeated attempts to rally from the 2025 low (US$54.87) have been repeatedly suppressed.
However, as long as oil prices hold above $57.82 (the 10-day moving average/the broken 38.2% Fibonacci retracement level), the short-term structure is expected to remain slightly bullish; if it falls below $57.55 (the 20-day moving average), it could trigger a deeper decline.
Resistance levels: 58.80; 59.63; 60.00; 60.48
Support levels: 57.82; 57.55; 57.00; 56.69
- Risk Warning and Disclaimer
- The market involves risk, and trading may not be suitable for all investors. This article is for reference only and does not constitute personal investment advice, nor does it take into account certain users’ specific investment objectives, financial situation, or other needs. Any investment decisions made based on this information are at your own risk.