Crude oil trading alert: Geopolitical tensions ease, oil prices return to range-bound trading.
2026-01-19 09:21:37
International crude oil prices continued their decline during Asian trading hours. Near-month West Texas Intermediate (WTI) crude futures fell 0.32% to $59.16 per barrel. As geopolitical tensions that had previously driven the oil price rebound gradually eased, investors began to shift their focus from potential supply disruptions to more realistic supply and demand fundamentals.
Barbara Lambrecht of Commerzbank Research stated that, given US President Trump's recent statements, the risk of immediate US intervention in the Iranian situation has significantly decreased, directly leading to a decline in the risk premium in oil prices.
She also pointed out that the possibility of escalation has not completely disappeared, but if the conflict eases further, the upcoming International Energy Agency monthly report may refocus on the oversupply issue, thus putting new downward pressure on oil prices.

Oil prices experienced significant volatility over the past week. WTI futures for February delivery ultimately rose 0.4% to settle at $59.44 a barrel, but plunged as much as 4.6% on Thursday, marking the biggest single-day drop since June; Brent futures for March delivery rose 0.6% to settle at $64.13 a barrel.
The sharp price fluctuations reflect the fluctuating flow of funds between geopolitical sentiment and macroeconomic expectations. Trump's latest remarks on social media are seen by the market as a significant turning point. His statement that he "highly respects" Iran's decision to lift the executions of protesters lowered market expectations for immediate strong action from the United States.
However, Washington continues to strengthen its military presence in the Middle East, with at least one aircraft carrier already deployed to the area and further deployments possible in the coming weeks, leaving uncertainty unresolved.
Warren Patterson, head of commodities strategy at ING, believes that although the risk of direct US intervention has subsided, it has not been completely ruled out, and the market will remain vigilant in the short term. If the US does not take concrete action, the risk premium will gradually dissipate, and more bearish fundamental factors will once again dominate prices.
Furthermore, the planned talks between the US and Ukraine in Miami, coupled with the continued uncertainty surrounding a potential ceasefire between Russia and Ukraine, are seen as a significant external obstacle to rising oil prices. Historically, during periods of heightened geopolitical risk, traders often hedge their short positions before the weekend, exacerbating market volatility.
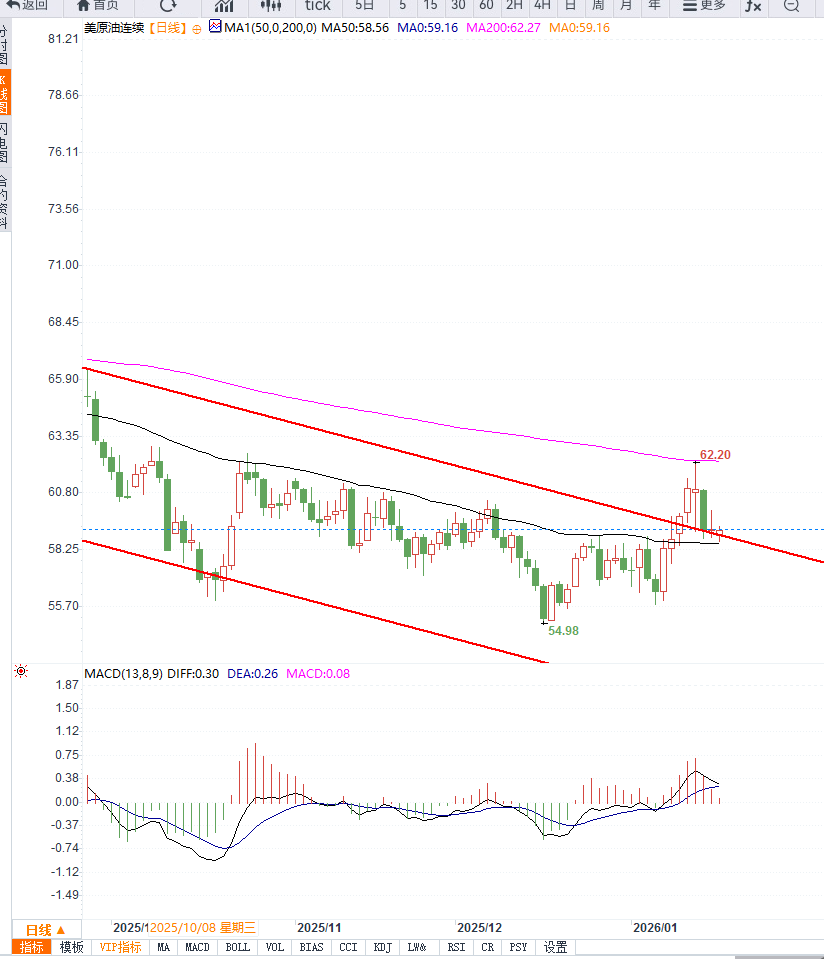
From the daily chart structure, WTI crude oil has formed a clear resistance zone near the $60 mark. This position coincides with the lower edge of the previous consolidation platform and is also subject to resistance from the medium-term moving average, indicating that the bulls have weak support in this price range.
Last week, oil prices briefly broke through resistance before quickly falling back and closing with a large bearish candlestick, indicating that the rebound was more of a technical correction than a trend reversal. Short-term moving averages have shown signs of weakening, with the 5-day moving average turning downwards and nearing a crossover below the 10-day moving average. The medium-term 20-day moving average remains above $60, providing dynamic resistance to prices.
The overall moving average system has gradually transitioned from a state of entanglement to a bearish alignment, reflecting a downward shift in the market's center of gravity. In terms of momentum indicators, the MACD has converged again below the zero line, the red bars have shortened significantly, and the fast and slow lines show signs of diverging downwards again, indicating a weakening of bullish momentum.
The Relative Strength Index (RSI) has fallen back into the neutral-to-weak zone but has not yet entered oversold territory, suggesting that prices still have room to decline further. Volatility indicators show a narrowing range, indicating that the market may choose a new direction after a brief period of consolidation.
Based on the chart pattern, the area around $58.20 is a key short-term support level. If it breaks down effectively, the price may further test the previous lows of $57.40 or even $56.50. Meanwhile, the $60.00-$60.50 range has become a key resistance level. Only by regaining a foothold in this area with increased trading volume can the short-term trend potentially turn stronger again.
Overall, the daily chart has shifted from a rebound structure to a sideways-to-bearish trend.
Editor's Note:
The crude oil market is currently undergoing a process of shifting from sentiment-driven to fundamental-driven. The temporary easing of tensions in the Middle East has led to a gradual correction of previously over-inflated geopolitical premiums, while the weakening global demand outlook and relatively ample production remain unchanged.
If the International Energy Agency's monthly report further confirms inventory accumulation and ample supply, oil prices may still decline. Overall, under the combined influence of receding risk premiums and weak fundamentals, crude oil is more likely to maintain a volatile but downward-biased trading pattern. Attention should be paid to the substantial impact of demand data and inventory changes on the price structure.
Barbara Lambrecht of Commerzbank Research stated that, given US President Trump's recent statements, the risk of immediate US intervention in the Iranian situation has significantly decreased, directly leading to a decline in the risk premium in oil prices.
She also pointed out that the possibility of escalation has not completely disappeared, but if the conflict eases further, the upcoming International Energy Agency monthly report may refocus on the oversupply issue, thus putting new downward pressure on oil prices.
Oil prices experienced significant volatility over the past week. WTI futures for February delivery ultimately rose 0.4% to settle at $59.44 a barrel, but plunged as much as 4.6% on Thursday, marking the biggest single-day drop since June; Brent futures for March delivery rose 0.6% to settle at $64.13 a barrel.
The sharp price fluctuations reflect the fluctuating flow of funds between geopolitical sentiment and macroeconomic expectations. Trump's latest remarks on social media are seen by the market as a significant turning point. His statement that he "highly respects" Iran's decision to lift the executions of protesters lowered market expectations for immediate strong action from the United States.
However, Washington continues to strengthen its military presence in the Middle East, with at least one aircraft carrier already deployed to the area and further deployments possible in the coming weeks, leaving uncertainty unresolved.
Warren Patterson, head of commodities strategy at ING, believes that although the risk of direct US intervention has subsided, it has not been completely ruled out, and the market will remain vigilant in the short term. If the US does not take concrete action, the risk premium will gradually dissipate, and more bearish fundamental factors will once again dominate prices.
Furthermore, the planned talks between the US and Ukraine in Miami, coupled with the continued uncertainty surrounding a potential ceasefire between Russia and Ukraine, are seen as a significant external obstacle to rising oil prices. Historically, during periods of heightened geopolitical risk, traders often hedge their short positions before the weekend, exacerbating market volatility.
From the daily chart structure, WTI crude oil has formed a clear resistance zone near the $60 mark. This position coincides with the lower edge of the previous consolidation platform and is also subject to resistance from the medium-term moving average, indicating that the bulls have weak support in this price range.
Last week, oil prices briefly broke through resistance before quickly falling back and closing with a large bearish candlestick, indicating that the rebound was more of a technical correction than a trend reversal. Short-term moving averages have shown signs of weakening, with the 5-day moving average turning downwards and nearing a crossover below the 10-day moving average. The medium-term 20-day moving average remains above $60, providing dynamic resistance to prices.
The overall moving average system has gradually transitioned from a state of entanglement to a bearish alignment, reflecting a downward shift in the market's center of gravity. In terms of momentum indicators, the MACD has converged again below the zero line, the red bars have shortened significantly, and the fast and slow lines show signs of diverging downwards again, indicating a weakening of bullish momentum.
The Relative Strength Index (RSI) has fallen back into the neutral-to-weak zone but has not yet entered oversold territory, suggesting that prices still have room to decline further. Volatility indicators show a narrowing range, indicating that the market may choose a new direction after a brief period of consolidation.
Based on the chart pattern, the area around $58.20 is a key short-term support level. If it breaks down effectively, the price may further test the previous lows of $57.40 or even $56.50. Meanwhile, the $60.00-$60.50 range has become a key resistance level. Only by regaining a foothold in this area with increased trading volume can the short-term trend potentially turn stronger again.
Overall, the daily chart has shifted from a rebound structure to a sideways-to-bearish trend.
Editor's Note:
The crude oil market is currently undergoing a process of shifting from sentiment-driven to fundamental-driven. The temporary easing of tensions in the Middle East has led to a gradual correction of previously over-inflated geopolitical premiums, while the weakening global demand outlook and relatively ample production remain unchanged.
If the International Energy Agency's monthly report further confirms inventory accumulation and ample supply, oil prices may still decline. Overall, under the combined influence of receding risk premiums and weak fundamentals, crude oil is more likely to maintain a volatile but downward-biased trading pattern. Attention should be paid to the substantial impact of demand data and inventory changes on the price structure.
- Risk Warning and Disclaimer
- The market involves risk, and trading may not be suitable for all investors. This article is for reference only and does not constitute personal investment advice, nor does it take into account certain users’ specific investment objectives, financial situation, or other needs. Any investment decisions made based on this information are at your own risk.