Did the Fed's hawkish specter crush gold? Gold has struggled to break through 5200; tonight's PPI will determine its fate.
2026-02-27 15:39:24
On Friday, February 27th, spot gold traded in a narrow range around $5185 per ounce during the European session. The long-term bullish trend for gold remains intact, but in the short term, bulls need to break through the $5200 level before the market can position itself for further gains. US President Donald Trump outlined reasons for a possible military strike against Iran in his State of the Union address and stated on Tuesday that he would not allow Iran to possess nuclear weapons. This factor, coupled with ongoing trade-related uncertainties, provided tailwind support for safe-haven gold.

After the Supreme Court ruled Trump's broad tariff policy illegal, the U.S. last week imposed a 10% tariff on all non-exempt goods—the rate Trump initially announced on Friday, rather than the 15% he promised the following day. However, a White House official said the administration is working to raise the rate to 15%, exacerbating market concerns about retaliatory measures and the economic impact of disruptions to global supply chains.
Given Trump's erratic handling of tariffs, market anxiety about how long these tariffs will last has kept investors on edge, becoming another factor supporting traditional safe-haven gold.
Meanwhile, after the January FOMC meeting minutes indicated the Fed was in no hurry to cut rates further, traders reduced their bets on a more aggressive easing policy from the Fed. Furthermore, officials discussed the possibility of a rate hike if inflation does not cool. This kept the dollar near its monthly high and limited upside for non-interest-bearing gold. On Friday during the European session, the dollar index traded in a narrow range around 97.80.
Furthermore, the agreement between the US and Iran to conduct further nuclear negotiations eased concerns about potential hostile actions. This helped to curb gold prices and kept bulls cautious.
Market focus has now shifted to the U.S. Producer Price Index (PPI) to be released later today. In addition, speeches by influential FOMC members will play a key role in driving demand for the dollar and provide some impetus for gold prices ahead of the weekend.
Nevertheless, gold prices are still on track for a fourth consecutive week of gains, and the broader fundamental backdrop suggests that any corrective pullback is more likely to be seen as a buying opportunity by the market.
The price action over the past three days has formed a rectangular pattern on the hourly chart. Meanwhile, gold prices remain above the rising 100-hour moving average (MA, 5177.87), and despite several intraday pullbacks, the short-term uptrend structure remains intact.
The Relative Strength Index (RSI) hovers below and near 50, reflecting a balance of momentum but not indicating downward pressure. The Moving Average Convergence/Divergence (MACD) indicator remains slightly above the zero line, and the MACD line is still above the signal line, reinforcing a mild upward tone rather than a momentum-driven rally.
On the upside, initial resistance appears around $5,200, where previous gains stalled and intraday selling pressure re-emerged. A break above this level would pave the way for the next upside resistance (near $5,220), at which point the latest upward wave would begin to appear to extend.
On the downside, immediate support is at the 100-hour moving average. A break below this level would expose deeper support at $5,130, which coincides with the recent lows and the lower end of the latest consolidation range.
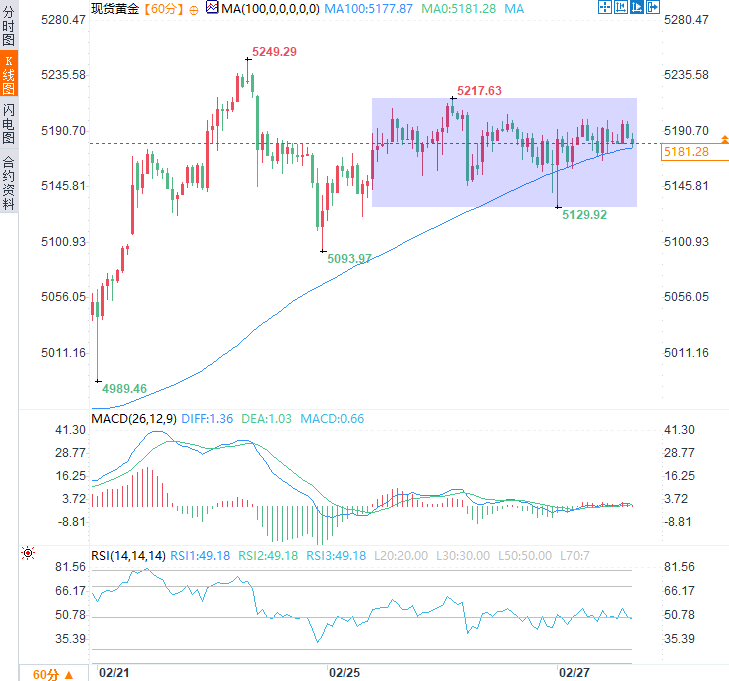
(Spot gold hourly chart, source: EasyForex)
At 15:30 Beijing time, spot gold was trading at $5179.66 per ounce.
After the Supreme Court ruled Trump's broad tariff policy illegal, the U.S. last week imposed a 10% tariff on all non-exempt goods—the rate Trump initially announced on Friday, rather than the 15% he promised the following day. However, a White House official said the administration is working to raise the rate to 15%, exacerbating market concerns about retaliatory measures and the economic impact of disruptions to global supply chains.
Given Trump's erratic handling of tariffs, market anxiety about how long these tariffs will last has kept investors on edge, becoming another factor supporting traditional safe-haven gold.
Meanwhile, after the January FOMC meeting minutes indicated the Fed was in no hurry to cut rates further, traders reduced their bets on a more aggressive easing policy from the Fed. Furthermore, officials discussed the possibility of a rate hike if inflation does not cool. This kept the dollar near its monthly high and limited upside for non-interest-bearing gold. On Friday during the European session, the dollar index traded in a narrow range around 97.80.
Furthermore, the agreement between the US and Iran to conduct further nuclear negotiations eased concerns about potential hostile actions. This helped to curb gold prices and kept bulls cautious.
Market focus has now shifted to the U.S. Producer Price Index (PPI) to be released later today. In addition, speeches by influential FOMC members will play a key role in driving demand for the dollar and provide some impetus for gold prices ahead of the weekend.
Nevertheless, gold prices are still on track for a fourth consecutive week of gains, and the broader fundamental backdrop suggests that any corrective pullback is more likely to be seen as a buying opportunity by the market.
If gold prices break through $5,200, they may retest the monthly high.
The price action over the past three days has formed a rectangular pattern on the hourly chart. Meanwhile, gold prices remain above the rising 100-hour moving average (MA, 5177.87), and despite several intraday pullbacks, the short-term uptrend structure remains intact.
The Relative Strength Index (RSI) hovers below and near 50, reflecting a balance of momentum but not indicating downward pressure. The Moving Average Convergence/Divergence (MACD) indicator remains slightly above the zero line, and the MACD line is still above the signal line, reinforcing a mild upward tone rather than a momentum-driven rally.
On the upside, initial resistance appears around $5,200, where previous gains stalled and intraday selling pressure re-emerged. A break above this level would pave the way for the next upside resistance (near $5,220), at which point the latest upward wave would begin to appear to extend.
On the downside, immediate support is at the 100-hour moving average. A break below this level would expose deeper support at $5,130, which coincides with the recent lows and the lower end of the latest consolidation range.
(Spot gold hourly chart, source: EasyForex)
At 15:30 Beijing time, spot gold was trading at $5179.66 per ounce.
- Risk Warning and Disclaimer
- The market involves risk, and trading may not be suitable for all investors. This article is for reference only and does not constitute personal investment advice, nor does it take into account certain users’ specific investment objectives, financial situation, or other needs. Any investment decisions made based on this information are at your own risk.