Gold prices remained range-bound at high levels as escalating tensions between the US and Iran, coupled with strong ISM data, offset the negative impact.
2026-03-05 09:55:11
On Thursday during Asian trading hours, spot gold (XAU/USD) traded around $5180, maintaining a generally bullish trend. The core driver of the price increase remains the geopolitical risk premium . The Israeli military announced a new round of strikes against military infrastructure in Tehran.
Meanwhile, discussions surrounding military action against Iran intensified in US politics. Republicans rejected a resolution requiring presidential approval for future military operations. This followed the Chairman of the Joint Chiefs of Staff's statement that the US would begin a "gradual" strike against targets within Iran. The anticipated escalation of the conflict strengthened market demand for safe-haven assets.
Against this backdrop, gold, as a traditional safe-haven asset, has benefited significantly. However, the fundamentals are not entirely bullish. Latest data shows that the US ISM Services PMI rose to 56.1, higher than the previous reading of 53.8 and significantly stronger than the market expectation of 53.5. This indicates that the expansion of US service sector activity has strengthened, and the economy remains resilient.
Strong economic data could prompt the Federal Reserve to maintain a "higher and longer" interest rate stance, thus supporting the dollar index and putting some downward pressure on gold. The market widely expects the Fed to keep interest rates unchanged until the summer, despite President Trump's continued calls for rate cuts.
The US initial jobless claims data to be released later, along with speeches from Federal Reserve officials, may provide further guidance for short-term price movements. The current rise in gold prices is not simply a trend-driven market movement, but rather a result of the balance between safe-haven demand and interest rate expectations.
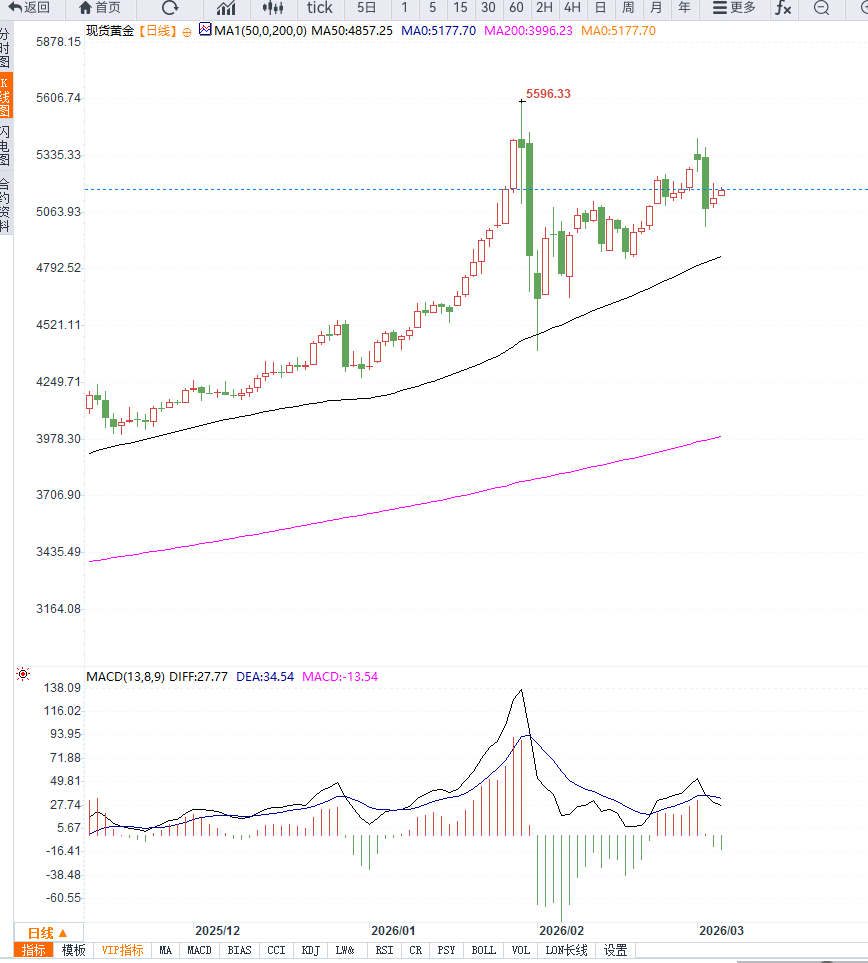
Daily chart trend: Overall, it remains within an upward trend channel, with highs continuing to rise. Moving average system: The price is firmly above the 20-day and 50-day moving averages, indicating a bullish medium-term trend. RSI indicator: Located around 65, it has not yet entered the extreme overbought zone and still has upward momentum.
Key resistance level: $5200 is the next psychological resistance level. Key support level: $5080 is short-term support, with strong support at the psychological level of $5000. The 4-hour chart shows a volatile upward trend in gold prices, with limited short-term pullbacks. A break below $5080 could test the $5000 area; a break above $5200 would open up new upside potential.
 Overall, the technical outlook remains strong, but it is approaching a relatively high level, and we need to be wary of the risk of a pullback due to changes in interest rate expectations.
Editor's Summary
The current surge in gold prices is not driven by recession fears, but rather by safe-haven buying fueled by geopolitical risks . Unlike previous instances, this round of geopolitical conflict, coupled with strong US economic data, has placed gold in a state of flux, with two opposing forces at play: Geopolitical risks → driving up gold prices; Strong economic data → supporting the dollar, suppressing gold prices. If the conflict escalates further and spreads to energy transportation corridors, gold could potentially test $5200 or even higher. However, if US data remains strong and reinforces expectations of prolonged high interest rates, a stronger dollar will limit gold price gains. In the short term, gold is expected to maintain a high-level, slightly bullish trend, but volatility may increase significantly. The market's true direction will depend on the duration of the conflict and changes in the Federal Reserve's policy signals.
Meanwhile, discussions surrounding military action against Iran intensified in US politics. Republicans rejected a resolution requiring presidential approval for future military operations. This followed the Chairman of the Joint Chiefs of Staff's statement that the US would begin a "gradual" strike against targets within Iran. The anticipated escalation of the conflict strengthened market demand for safe-haven assets.
Against this backdrop, gold, as a traditional safe-haven asset, has benefited significantly. However, the fundamentals are not entirely bullish. Latest data shows that the US ISM Services PMI rose to 56.1, higher than the previous reading of 53.8 and significantly stronger than the market expectation of 53.5. This indicates that the expansion of US service sector activity has strengthened, and the economy remains resilient.
Strong economic data could prompt the Federal Reserve to maintain a "higher and longer" interest rate stance, thus supporting the dollar index and putting some downward pressure on gold. The market widely expects the Fed to keep interest rates unchanged until the summer, despite President Trump's continued calls for rate cuts.
The US initial jobless claims data to be released later, along with speeches from Federal Reserve officials, may provide further guidance for short-term price movements. The current rise in gold prices is not simply a trend-driven market movement, but rather a result of the balance between safe-haven demand and interest rate expectations.
Daily chart trend: Overall, it remains within an upward trend channel, with highs continuing to rise. Moving average system: The price is firmly above the 20-day and 50-day moving averages, indicating a bullish medium-term trend. RSI indicator: Located around 65, it has not yet entered the extreme overbought zone and still has upward momentum.
Key resistance level: $5200 is the next psychological resistance level. Key support level: $5080 is short-term support, with strong support at the psychological level of $5000. The 4-hour chart shows a volatile upward trend in gold prices, with limited short-term pullbacks. A break below $5080 could test the $5000 area; a break above $5200 would open up new upside potential.
Overall, the technical outlook remains strong, but it is approaching a relatively high level, and we need to be wary of the risk of a pullback due to changes in interest rate expectations.Editor's Summary
The current surge in gold prices is not driven by recession fears, but rather by safe-haven buying fueled by geopolitical risks . Unlike previous instances, this round of geopolitical conflict, coupled with strong US economic data, has placed gold in a state of flux, with two opposing forces at play: Geopolitical risks → driving up gold prices; Strong economic data → supporting the dollar, suppressing gold prices. If the conflict escalates further and spreads to energy transportation corridors, gold could potentially test $5200 or even higher. However, if US data remains strong and reinforces expectations of prolonged high interest rates, a stronger dollar will limit gold price gains. In the short term, gold is expected to maintain a high-level, slightly bullish trend, but volatility may increase significantly. The market's true direction will depend on the duration of the conflict and changes in the Federal Reserve's policy signals.
- Risk Warning and Disclaimer
- The market involves risk, and trading may not be suitable for all investors. This article is for reference only and does not constitute personal investment advice, nor does it take into account certain users’ specific investment objectives, financial situation, or other needs. Any investment decisions made based on this information are at your own risk.