Satellite outage, oil field fire: Who's secretly entering the market? Unveiling the true trigger points for gold and oil price movements over the next three days.
2026-03-10 20:44:39
As we enter the crucial window of mid-March 2026, global financial markets are experiencing a period of volatility characterized by a high degree of interplay between geopolitical risks and macroeconomic policy expectations. Influenced by the "Rashomon effect" of the evolving situation in Iran, geopolitical premiums have become dominant in the pricing of core assets such as crude oil, the US dollar, and gold. Today, due to significant divergence in narratives from various parties, the market is oscillating wildly between expectations of a protracted war and expectations of a peaceful resolution based on Trump's tariff rhetoric.
Judging from the current market performance, the market is not only digesting the sudden news of the energy infrastructure attacks in the past 24 hours, but also betting on the potential intervention window of the new US administration. While risk aversion has not completely spiraled out of control, the delayed release of key satellite imagery data has increased information asymmetry, causing investors to be extremely restrained in their decision-making. This "restraint" is not indifference, but rather a vigilance against liquidity risks and a breakdown in pricing logic before a major storm.
Over the past 24 hours, news regarding the situation in Iran has been extremely complex, directly impacting market risk appetite for the next 2-3 trading days. Firstly, reports from well-known institutions indicate that Israel is attempting to maximize disruption to Iranian targets before a potential political window closes. This military acceleration ahead of a specific diplomatic juncture has injected significant uncertainty into the oil market. If the strikes expand further to non-military targets, the supply-side shock to oil prices will shift from expectation to reality.
Secondly, Trump's recent statements are characterized by a typical "two-way game." In media interviews, he both defended the necessity of "preemptive strikes" and signaled the possibility of "dialogue." This mixed signal has suppressed the continued upward momentum of crude oil prices in the short term. According to analysis by well-known media outlets, his team is deeply concerned about the potential for inflationary rebound and declining public approval ratings caused by persistently high oil prices. This internal pressure may prompt the US government to seek some form of "exit strategy" in the near future.
However, this optimistic expectation of a "quick end" is facing serious challenges. Iran has not only demonstrated high stability in its leadership succession but has also conveyed a tough stance through senior officials, indicating its "fearlessness of threats" and readiness for a "protracted war of attrition." In particular, the drone attack and fire at the Ruwais Industrial Complex in Abu Dhabi (one of the world's core refining bases) and the damage to communications facilities at a US military base in Qatar in the past 24 hours have directly exposed the vulnerabilities of global energy supply. At this juncture, the logic of energy security is clearly more persuasive in the market than mere verbal expressions of peace.
Furthermore, a detail that cannot be ignored is that the Pentagon reportedly used up $5.6 billion of its ammunition reserves in the two days leading up to the conflict. This massive expenditure not only tested the US military stockpile but also put pressure on the long-term credibility of the dollar index, partially explaining why the dollar index did not experience the usual unilateral surge in strength amid escalating conflict.
1. Crude Oil Market: Brent and WTI Crude Oil Consolidation and Resistance Level Rebound
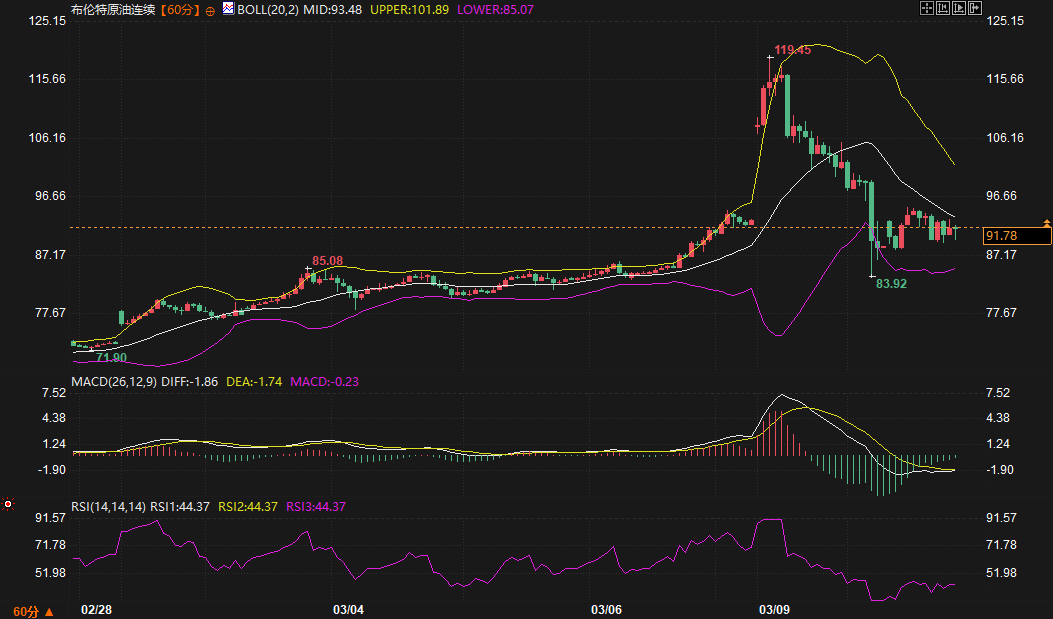
From a technical chart perspective, the crude oil market is currently in a low-level, wide-range consolidation phase following a sharp drop. Brent crude oil futures contracts retreated significantly after reaching a peak of $119.45, and are currently fluctuating around $91.78 per barrel.
Resistance Zone Logic: In the short term, Brent crude oil faces significant resistance around the Bollinger Band middle line at $93.50. While the MACD histogram is shortening, the DIFF and DEA lines remain below the zero line, indicating that the bullish counterattack is still weak. The RSI indicator is currently hovering around 44.37, in a neutral to weak range, suggesting that the market is awaiting a clearer report on infrastructure damage.
Support range prediction: Strong support is located near the lower Bollinger Band at $85.07, which coincides with the previous high of the consolidation range.
Key focus during the trading session: In the next 48 hours, the official assessment of the extent of damage to the Ruwais facility will be crucial. If it is confirmed to be long-term damage, the price will challenge the $95-$98 range.
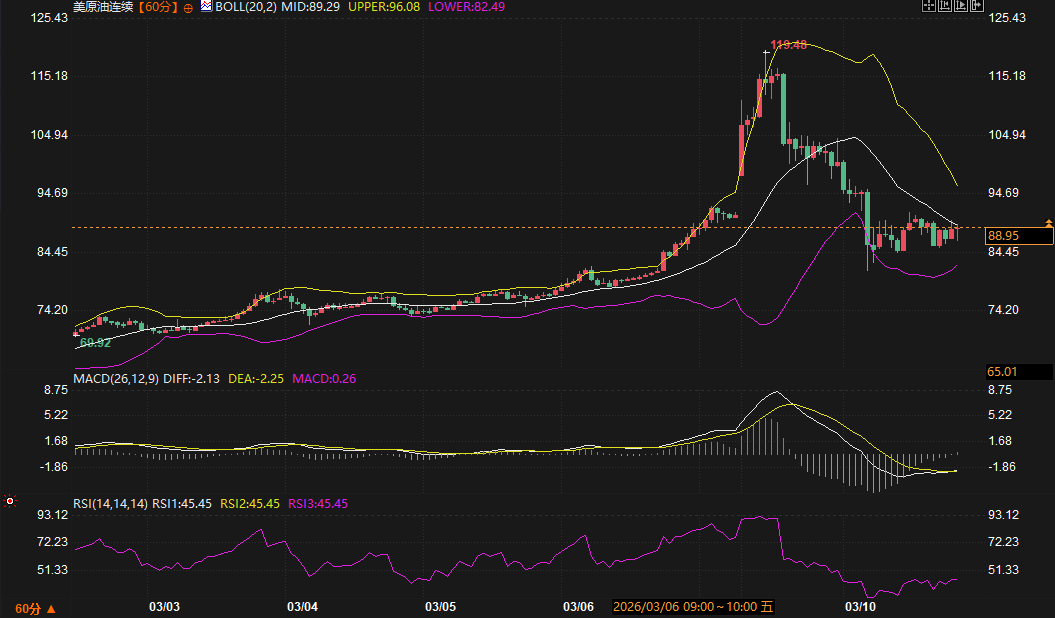
WTI crude oil is moving in close tandem with Brent crude, currently trading around $88.95. Its MACD histogram has begun to turn positive, indicating a weakening of downward momentum.
Resistance zone: Pay close attention to the Bollinger Band middle line at $89.30. If it can hold above this level, it may test the upper Bollinger Band at $96.
Support range: The lower boundary of $82.49 is a key defense line.
2. Spot Gold: Strong Return of Safe-Haven Properties and Bullish Pattern
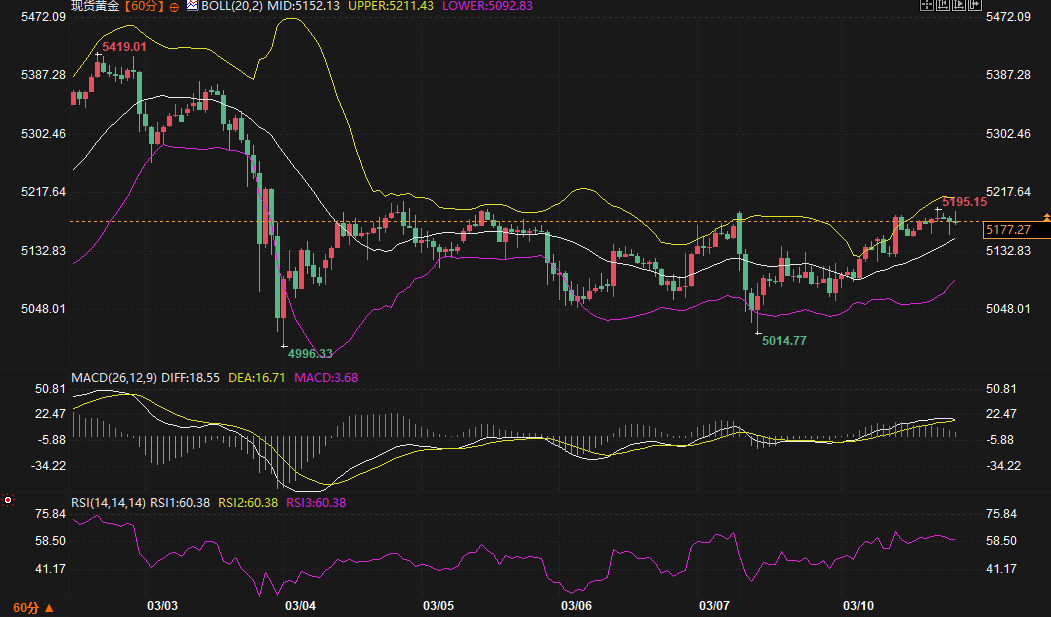
Unlike the volatile price action of crude oil, spot gold has shown a stronger independent rebound. It is currently priced at 5177.27 yuan/gram.
Technical Analysis: Gold prices are currently trading along the upper Bollinger Band, exhibiting a typical rebound trend. The MACD histogram continues to expand, and the RSI is in the relatively strong range of 60.38, indicating that safe-haven funds are accelerating their inflow into the gold market to hedge against uncontrollable "black swan" risks in the geopolitical situation.
Resistance level logic: Short-term resistance is located at the previous high of 5195.15 yuan/gram. As the narrative of a potentially protracted conflict intensifies, this resistance level faces the risk of being broken.
Support range prediction: The first support level is at the middle Bollinger Band at 5152.13 yuan/gram, with further support around 5092 yuan.
3. US Dollar Index: Weak Recovery After Falling from Highs
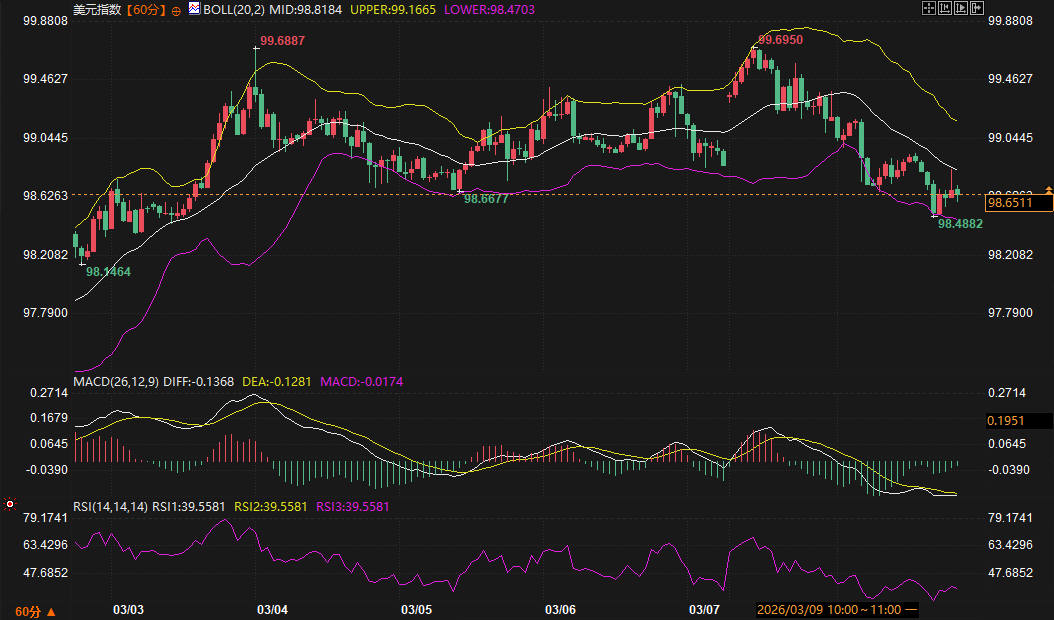
After hitting a high of 99.69, the US dollar index has continued to fall and is currently around 98.65, with the price below the middle Bollinger Band.
Trend Analysis: Despite geopolitical tensions, internal US debates regarding excessive military spending and a "rapid withdrawal" have diminished the dollar's perceived value as a safe-haven asset. The MACD histogram is extremely short, indicating a highly conflicted market.
Resistance range: Short-term resistance is located near the middle band at 98.82.
Support zone: The recent pullback low of 98.48 and the lower trendline of 98.47 form a solid bottom support. If this level is broken, the market may further decline to 98.15.
Looking ahead to the next two to three trading days, the market will enter an extremely sensitive period of logical verification.
In the crude oil market, the biggest variable lies in the interplay between "Israel's accelerated actions" and "the security of Gulf oil fields." If no new large-scale facility damage is reported in the next 48 hours, and Trump's peace rhetoric remains dominant, oil prices will likely fluctuate within the $88-94 range. However, if Iranian proxies escalate their attacks on US military bases or energy nodes, there is a structural impetus for oil prices to return above $100.
In the gold market, due to the strong resilience shown by Iran's new leadership, geopolitical safe-haven pricing is likely to become a long-term trend. Gold is expected to maintain a slightly bullish trend with greater sensitivity to positive geopolitical news than negative news.
In the dollar market, investors need to closely monitor domestic fiscal discussions in the United States. If a surge in military spending leads to new funding disputes in Congress, the dollar may come under pressure in the short term, and could even decouple from gold prices. Overall, the dollar index is likely to find a new equilibrium point within the 98.40-99.10 range in the near term.
Overall, market movements in the coming days will depend on whose narrative is closer to the "truth": the "rapid victory" claimed by the US and Israel, or the "ten-year war" presented by Iran. In this highly transparent yet highly ambiguous situation, controlling volatility risk will be the primary task for professional institutional investors.
1. Why did Trump's "quick end" rhetoric have such a direct impact on oil prices?
The core logic behind this phenomenon lies in the market's pricing of "certainty." In the past few days, oil prices have fallen sharply from $120 to the $90 range, primarily not because supply has recovered, but because the market expects the new US administration to quickly quell the conflict through force or diplomatic mediation. Trump's rhetoric is essentially providing the market with a "peace discount." However, this pricing is very fragile because it heavily relies on verbal promises. If Israel continues its attacks in the next 48 hours, or if the damage to Iranian energy facilities proves impossible to repair in the short term, this decline driven by "expected peace" will be quickly wiped out, triggering a second surge.
2. What long-term signals do the changes in Iran's leadership send to the financial markets?
According to reports from prominent media outlets, the fact that Khamenei's son has succeeded him and that the regime structure remains stable will have a long-term and profound impact on the market. It directly refutes the Western narrative's assumption that the Iranian regime will collapse rapidly. For financial markets, this means the conflict is highly likely to evolve into a "war of attrition" rather than a "blitzkrieg." A prolonged conflict means that shipping insurance costs and oil premiums in the Gulf region will remain above historical averages for an extended period. This will not only push up global inflation expectations but also alter long-term valuation models for commodities.
3. What substantive impact will the delayed release of satellite imagery have on the transaction process?
In modern financial trading, high-frequency satellite data is a core basis for assessing geopolitical damage (BDA). Currently, the delayed release of images by institutions such as Planet Labs has prevented the market from objectively verifying the actual extent of damage to energy facilities in Tehran or the Gulf region. This information vacuum creates space for "rumor trading." For traders, this means increased market gap risk, because once satellite images are released and show damage exceeding expectations, prices can experience a sudden and discontinuous upward surge; conversely, if the damage is minor, a stampede-like decline can occur.
4. Why has the US dollar index weakened amid escalating conflict?
This is typically related to two factors: first, expectations of fiscal burden, as the $5.6 billion military expenditure in just two days has raised market concerns that the US fiscal deficit will further expand; second, interest rate differentials, as the market anticipates that the war will force the Federal Reserve to prioritize maintaining the economy over inflationary pressures and the risk of recession, thus potentially hindering expectations of interest rate hikes. Furthermore, while Trump's tariff rhetoric has supported the dollar to some extent, the accompanying expansionary fiscal expectations have offset some safe-haven buying, causing the dollar to encounter significant resistance near the 99 level.
5. Why has the correlation between gold and crude oil diverged at this stage?
Over the past 24 hours, gold has rebounded while crude oil has fluctuated. This divergence stems from the difference in their pricing logic: crude oil pricing is currently caught between "peace expectations" and "physical supply disruptions," meaning that as long as large-scale oil fields don't ignite, oil prices are easily suppressed by peace rhetoric. Gold, as the ultimate safe-haven asset, is not only involved in pricing wars but also in pricing "uncertainty" and "geopolitical restructuring." Even if a ceasefire does occur, gold will be supported by the cracks in global credit and the antagonism between geopolitical blocs. Simply put, gold is shifting from a "crisis mode" to a long-term pricing model based on "geopolitical restructuring."
Judging from the current market performance, the market is not only digesting the sudden news of the energy infrastructure attacks in the past 24 hours, but also betting on the potential intervention window of the new US administration. While risk aversion has not completely spiraled out of control, the delayed release of key satellite imagery data has increased information asymmetry, causing investors to be extremely restrained in their decision-making. This "restraint" is not indifference, but rather a vigilance against liquidity risks and a breakdown in pricing logic before a major storm.
Core fundamental drivers: Multi-dimensional narrative conflicts and the "extreme pressure" on the energy supply chain.
Over the past 24 hours, news regarding the situation in Iran has been extremely complex, directly impacting market risk appetite for the next 2-3 trading days. Firstly, reports from well-known institutions indicate that Israel is attempting to maximize disruption to Iranian targets before a potential political window closes. This military acceleration ahead of a specific diplomatic juncture has injected significant uncertainty into the oil market. If the strikes expand further to non-military targets, the supply-side shock to oil prices will shift from expectation to reality.
Secondly, Trump's recent statements are characterized by a typical "two-way game." In media interviews, he both defended the necessity of "preemptive strikes" and signaled the possibility of "dialogue." This mixed signal has suppressed the continued upward momentum of crude oil prices in the short term. According to analysis by well-known media outlets, his team is deeply concerned about the potential for inflationary rebound and declining public approval ratings caused by persistently high oil prices. This internal pressure may prompt the US government to seek some form of "exit strategy" in the near future.
However, this optimistic expectation of a "quick end" is facing serious challenges. Iran has not only demonstrated high stability in its leadership succession but has also conveyed a tough stance through senior officials, indicating its "fearlessness of threats" and readiness for a "protracted war of attrition." In particular, the drone attack and fire at the Ruwais Industrial Complex in Abu Dhabi (one of the world's core refining bases) and the damage to communications facilities at a US military base in Qatar in the past 24 hours have directly exposed the vulnerabilities of global energy supply. At this juncture, the logic of energy security is clearly more persuasive in the market than mere verbal expressions of peace.
Furthermore, a detail that cannot be ignored is that the Pentagon reportedly used up $5.6 billion of its ammunition reserves in the two days leading up to the conflict. This massive expenditure not only tested the US military stockpile but also put pressure on the long-term credibility of the dollar index, partially explaining why the dollar index did not experience the usual unilateral surge in strength amid escalating conflict.
In-depth technical analysis: The consolidation and range-bound logic of key assets
1. Crude Oil Market: Brent and WTI Crude Oil Consolidation and Resistance Level Rebound
From a technical chart perspective, the crude oil market is currently in a low-level, wide-range consolidation phase following a sharp drop. Brent crude oil futures contracts retreated significantly after reaching a peak of $119.45, and are currently fluctuating around $91.78 per barrel.
Resistance Zone Logic: In the short term, Brent crude oil faces significant resistance around the Bollinger Band middle line at $93.50. While the MACD histogram is shortening, the DIFF and DEA lines remain below the zero line, indicating that the bullish counterattack is still weak. The RSI indicator is currently hovering around 44.37, in a neutral to weak range, suggesting that the market is awaiting a clearer report on infrastructure damage.
Support range prediction: Strong support is located near the lower Bollinger Band at $85.07, which coincides with the previous high of the consolidation range.
Key focus during the trading session: In the next 48 hours, the official assessment of the extent of damage to the Ruwais facility will be crucial. If it is confirmed to be long-term damage, the price will challenge the $95-$98 range.
WTI crude oil is moving in close tandem with Brent crude, currently trading around $88.95. Its MACD histogram has begun to turn positive, indicating a weakening of downward momentum.
Resistance zone: Pay close attention to the Bollinger Band middle line at $89.30. If it can hold above this level, it may test the upper Bollinger Band at $96.
Support range: The lower boundary of $82.49 is a key defense line.
2. Spot Gold: Strong Return of Safe-Haven Properties and Bullish Pattern
Unlike the volatile price action of crude oil, spot gold has shown a stronger independent rebound. It is currently priced at 5177.27 yuan/gram.
Technical Analysis: Gold prices are currently trading along the upper Bollinger Band, exhibiting a typical rebound trend. The MACD histogram continues to expand, and the RSI is in the relatively strong range of 60.38, indicating that safe-haven funds are accelerating their inflow into the gold market to hedge against uncontrollable "black swan" risks in the geopolitical situation.
Resistance level logic: Short-term resistance is located at the previous high of 5195.15 yuan/gram. As the narrative of a potentially protracted conflict intensifies, this resistance level faces the risk of being broken.
Support range prediction: The first support level is at the middle Bollinger Band at 5152.13 yuan/gram, with further support around 5092 yuan.
3. US Dollar Index: Weak Recovery After Falling from Highs
After hitting a high of 99.69, the US dollar index has continued to fall and is currently around 98.65, with the price below the middle Bollinger Band.
Trend Analysis: Despite geopolitical tensions, internal US debates regarding excessive military spending and a "rapid withdrawal" have diminished the dollar's perceived value as a safe-haven asset. The MACD histogram is extremely short, indicating a highly conflicted market.
Resistance range: Short-term resistance is located near the middle band at 98.82.
Support zone: The recent pullback low of 98.48 and the lower trendline of 98.47 form a solid bottom support. If this level is broken, the market may further decline to 98.15.
Outlook for the next 2-3 days: Increased volatility and a narrative turning point
Looking ahead to the next two to three trading days, the market will enter an extremely sensitive period of logical verification.
In the crude oil market, the biggest variable lies in the interplay between "Israel's accelerated actions" and "the security of Gulf oil fields." If no new large-scale facility damage is reported in the next 48 hours, and Trump's peace rhetoric remains dominant, oil prices will likely fluctuate within the $88-94 range. However, if Iranian proxies escalate their attacks on US military bases or energy nodes, there is a structural impetus for oil prices to return above $100.
In the gold market, due to the strong resilience shown by Iran's new leadership, geopolitical safe-haven pricing is likely to become a long-term trend. Gold is expected to maintain a slightly bullish trend with greater sensitivity to positive geopolitical news than negative news.
In the dollar market, investors need to closely monitor domestic fiscal discussions in the United States. If a surge in military spending leads to new funding disputes in Congress, the dollar may come under pressure in the short term, and could even decouple from gold prices. Overall, the dollar index is likely to find a new equilibrium point within the 98.40-99.10 range in the near term.
Overall, market movements in the coming days will depend on whose narrative is closer to the "truth": the "rapid victory" claimed by the US and Israel, or the "ten-year war" presented by Iran. In this highly transparent yet highly ambiguous situation, controlling volatility risk will be the primary task for professional institutional investors.
Frequently Asked Questions
1. Why did Trump's "quick end" rhetoric have such a direct impact on oil prices?
The core logic behind this phenomenon lies in the market's pricing of "certainty." In the past few days, oil prices have fallen sharply from $120 to the $90 range, primarily not because supply has recovered, but because the market expects the new US administration to quickly quell the conflict through force or diplomatic mediation. Trump's rhetoric is essentially providing the market with a "peace discount." However, this pricing is very fragile because it heavily relies on verbal promises. If Israel continues its attacks in the next 48 hours, or if the damage to Iranian energy facilities proves impossible to repair in the short term, this decline driven by "expected peace" will be quickly wiped out, triggering a second surge.
2. What long-term signals do the changes in Iran's leadership send to the financial markets?
According to reports from prominent media outlets, the fact that Khamenei's son has succeeded him and that the regime structure remains stable will have a long-term and profound impact on the market. It directly refutes the Western narrative's assumption that the Iranian regime will collapse rapidly. For financial markets, this means the conflict is highly likely to evolve into a "war of attrition" rather than a "blitzkrieg." A prolonged conflict means that shipping insurance costs and oil premiums in the Gulf region will remain above historical averages for an extended period. This will not only push up global inflation expectations but also alter long-term valuation models for commodities.
3. What substantive impact will the delayed release of satellite imagery have on the transaction process?
In modern financial trading, high-frequency satellite data is a core basis for assessing geopolitical damage (BDA). Currently, the delayed release of images by institutions such as Planet Labs has prevented the market from objectively verifying the actual extent of damage to energy facilities in Tehran or the Gulf region. This information vacuum creates space for "rumor trading." For traders, this means increased market gap risk, because once satellite images are released and show damage exceeding expectations, prices can experience a sudden and discontinuous upward surge; conversely, if the damage is minor, a stampede-like decline can occur.
4. Why has the US dollar index weakened amid escalating conflict?
This is typically related to two factors: first, expectations of fiscal burden, as the $5.6 billion military expenditure in just two days has raised market concerns that the US fiscal deficit will further expand; second, interest rate differentials, as the market anticipates that the war will force the Federal Reserve to prioritize maintaining the economy over inflationary pressures and the risk of recession, thus potentially hindering expectations of interest rate hikes. Furthermore, while Trump's tariff rhetoric has supported the dollar to some extent, the accompanying expansionary fiscal expectations have offset some safe-haven buying, causing the dollar to encounter significant resistance near the 99 level.
5. Why has the correlation between gold and crude oil diverged at this stage?
Over the past 24 hours, gold has rebounded while crude oil has fluctuated. This divergence stems from the difference in their pricing logic: crude oil pricing is currently caught between "peace expectations" and "physical supply disruptions," meaning that as long as large-scale oil fields don't ignite, oil prices are easily suppressed by peace rhetoric. Gold, as the ultimate safe-haven asset, is not only involved in pricing wars but also in pricing "uncertainty" and "geopolitical restructuring." Even if a ceasefire does occur, gold will be supported by the cracks in global credit and the antagonism between geopolitical blocs. Simply put, gold is shifting from a "crisis mode" to a long-term pricing model based on "geopolitical restructuring."
- Risk Warning and Disclaimer
- The market involves risk, and trading may not be suitable for all investors. This article is for reference only and does not constitute personal investment advice, nor does it take into account certain users’ specific investment objectives, financial situation, or other needs. Any investment decisions made based on this information are at your own risk.