Another incident in the Strait of Hormuz, US Treasury bonds and the US dollar are soaring, so why is gold still so strong?
2026-03-11 20:29:40
On Wednesday (March 11), global financial markets were caught in a double bind of extreme geopolitical uncertainty and expectations of tightening macro liquidity. In the past 24 hours, the situation in the Strait of Hormuz, a vital global energy artery, did not show any substantial easing as previously rumored. Instead, it plunged into a deeper shipping paralysis due to attacks on several non-tanker vessels and the collapse of rumors of US escort. Currently, commercial traffic through the strait has fallen to near zero, and this real threat of energy supply disruption is prompting the International Energy Agency (IEA) to plan the largest strategic reserve deployment in history. Affected by this, crude oil prices attempted to bottom out and rebound amidst sharp fluctuations, while the US dollar and US Treasury yields both rose driven by inflation anxieties. Spot gold, on the other hand, exhibited strong safe-haven resilience, and the battle between bulls and bears has entered a heated phase.
The situation over the past 24 hours has shown a high degree of logical coherence, with the core issue being the struggle between the confirmation of physical blockade and official measures to quell the unrest.
1. Persistent Physical Supply Disruptions <br/>According to the latest monitoring, although the White House denied previous claims that the US military was escorting oil tankers through the Strait of Hormuz, the market has clearly perceived the current physical isolation of the Strait of Hormuz. In the past day, only one commercial vessel confirmed passage through the area, a daily traffic volume that has plummeted by 86% compared to the 2026 average. More threateningly, three ship damage incidents occurred in the past 24 hours (including Japanese and Marshall Islands-flagged bulk carriers). Although not targeting oil tankers, these incidents significantly increased the war risk premium, causing insurance costs per voyage to soar to $500,000 to $1 million. This "de facto blockade" has prompted energy giants such as Saudi Aramco to warn that if the disruption continues, the current five-year low in global inventories will have catastrophic consequences.
2. Hedging the Largest Reserve Release Plan in History <br />In response to the aforementioned supply disruptions, the International Oil Agency (IEA) has proposed releasing 400 million barrels of strategic petroleum reserves, more than double the amount released during the Russia-Ukraine conflict in 2022. This move aims to hedge against geopolitical premiums through administrative intervention. Currently, Germany and Japan have expressed a strong willingness to cooperate, with Japan planning to begin releasing reserves as early as March 16th. This policy is expected to effectively curb the extreme upward momentum of Brent crude oil towards $120 in the past 12 hours, but it has also triggered deep concerns in the market about insufficient "reserve ammunition."
3. The Link Between Inflation Expectations and Monetary Policy <br />Geopolitical conflicts driving up energy prices have already spilled over into the bond market. The market widely expects the upcoming US February CPI data to exceed expectations due to higher gasoline costs, directly weakening market bets on interest rate cuts. European Central Bank officials have even signaled a hawkish stance on an earlier rate hike. This expectation of "high inflation + high interest rates" has not only boosted the US dollar index but also kept the 10-year US Treasury yield above 4.1%, putting technical pressure on gold. However, the spillover safe-haven demand has provided support.
Based on market movements and technical charts over the past 24 hours, the following is an analysis of the trends of the three core assets over the next 2-3 days.
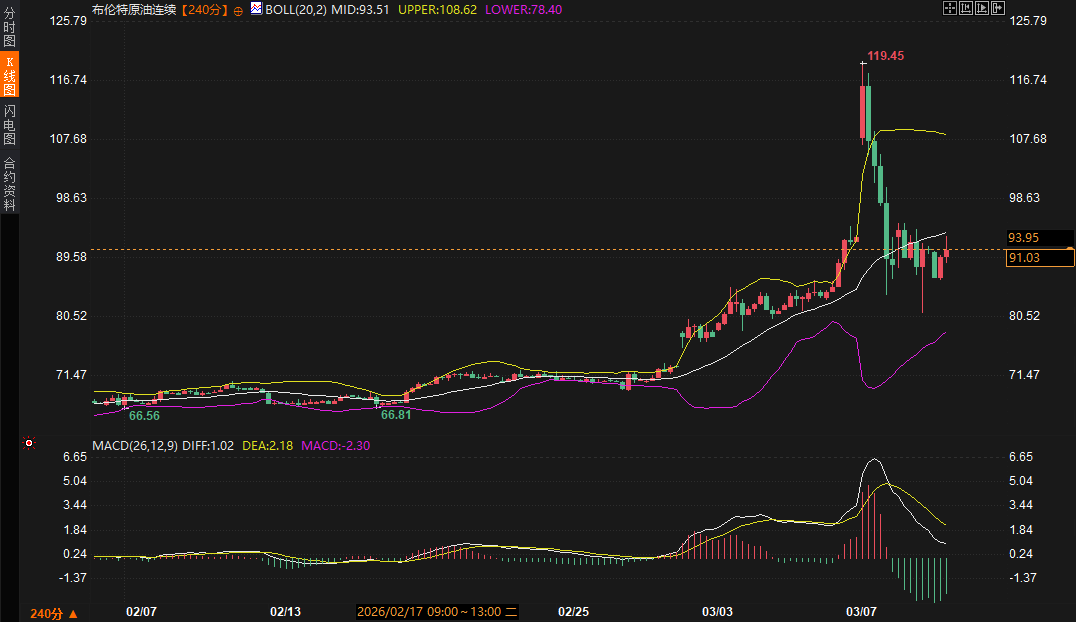
Brent Crude Oil: Consolidation After Dramatic Volatility <br/>Technical Analysis: The 240-minute chart shows that Brent crude oil, after retreating from its extreme high of $119.45, is currently fluctuating around $91.03. The MACD death cross has not completely dissipated, indicating that the bearish momentum remains, but the price action is closely following the Bollinger Band's middle line, reflecting the market's need for portfolio adjustments after the $28 plunge.
Logical support: Although the IEA's release of reserves dampened speculative bullish sentiment, the zero-passage status of the Strait of Hormuz provided strong physical support.
Support and resistance levels: Support below: $78.40 (lower Bollinger Band) to the $80.00 psychological level.
Resistance levels: $93.51 (Bollinger Band middle line) and the densely traded area at $98.00.
Key points to watch during trading hours: Whether IEA member countries will formally approve the 400 million barrel release plan on Wednesday, and whether there will be any new escort operations in the Strait of Hormuz.
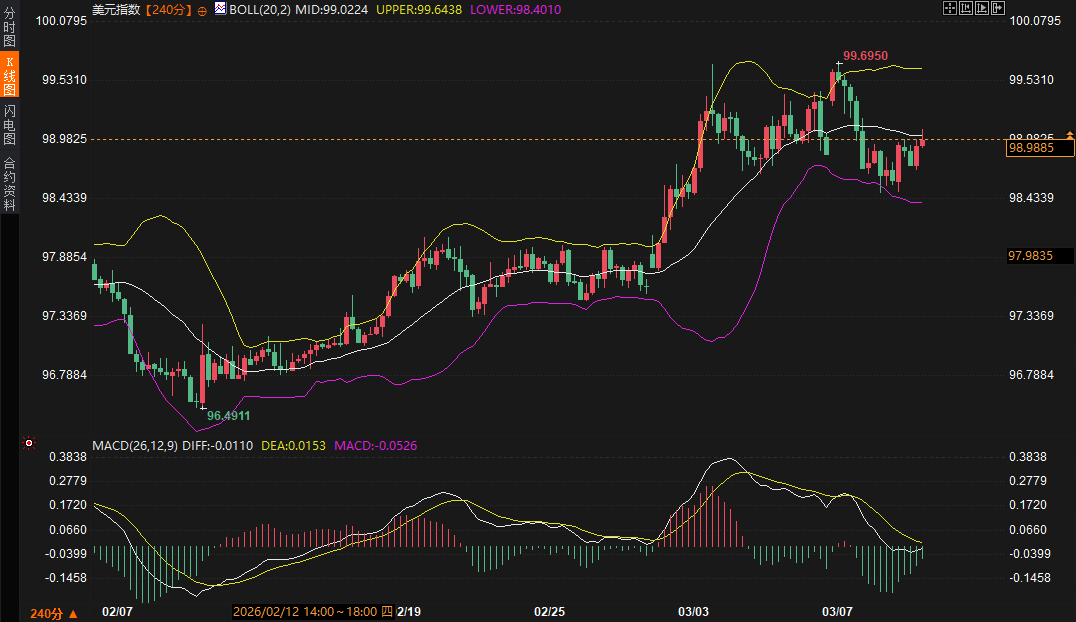
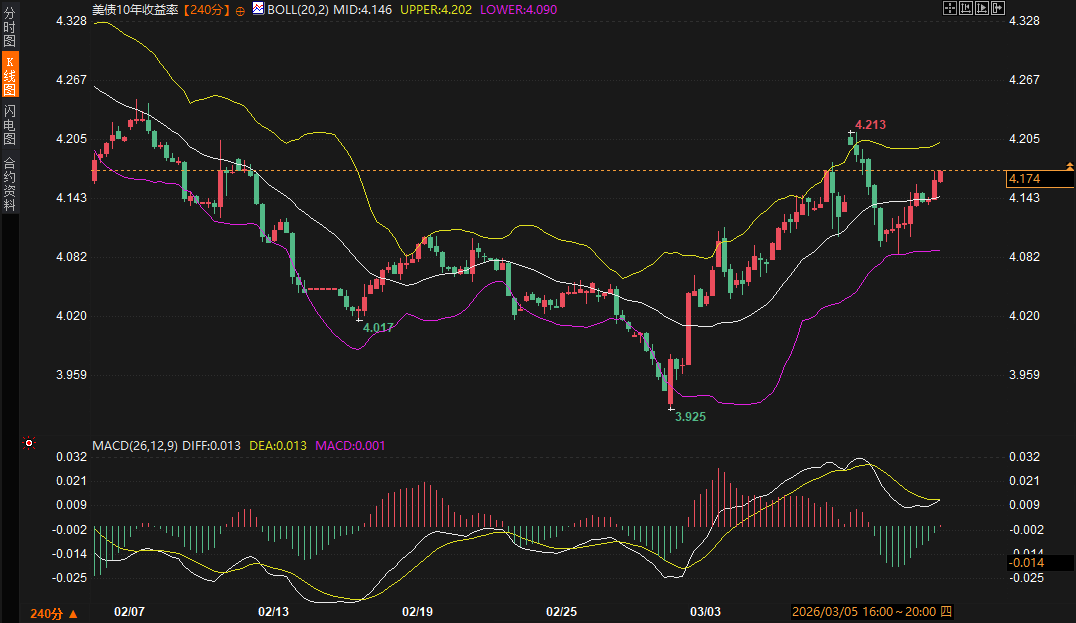
US Dollar Index and US Treasuries: High-Level Consolidation Amidst Strong Coordination <br/>Technical Analysis: The US Dollar Index is currently around 98.98, closely following the Bollinger Band's middle line (99.02). The MACD green histogram is narrowing slightly, indicating weakening downward momentum and a stronger rebound intention. The 10-year US Treasury yield has broken through the middle line and is approaching the upper line at 4.20%, showing a relatively strong trend.
Logical support: Safe-haven flows and bets against inflation are the main drivers of the US dollar's performance. Due to instability in the Taiwan Strait, the risk of energy inflation has significantly increased the probability that the Federal Reserve will remain on hold.
Support and resistance levels: Support levels below: 98.40 (US Dollar Index), 4.14% (US Treasury Yield).
Resistance levels: 99.69 (recent high of the US dollar index), 4.21% (high of US Treasury yields).
Key focus during trading: Tonight's US CPI data. If the figure is high, it will directly drive the US dollar to rise again.
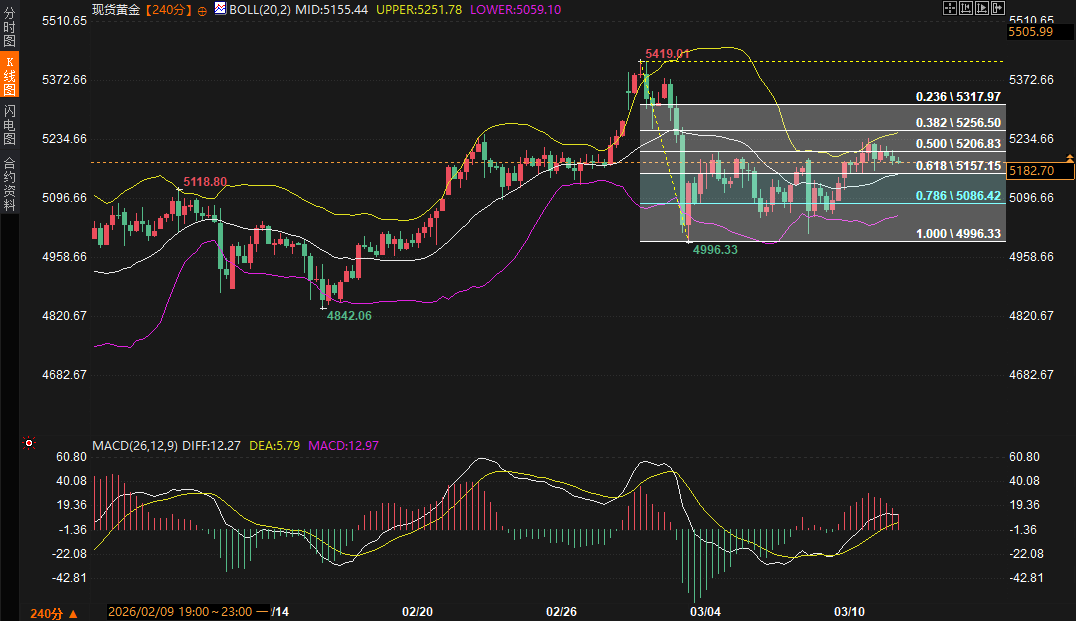
Spot Gold: Defensive Counterattack from a W-Shaped Bottom <br/>Technical Analysis: Gold is currently priced at $5182.70 per ounce. The MACD shows a golden cross, and the red momentum bars continue to expand, indicating that the bulls have regained the initiative after a significant pullback. The candlestick pattern has formed a solid W-shaped rebound structure above $5100.
Logical support: Gold is currently caught in a struggle between "high interest rate pressure" and "safe-haven buying support." Recent energy price volatility and stagflation concerns have significantly increased its attractiveness as a risk-hedging asset.
Support and resistance range: Support below: $5155-$5157 (the area where the Bollinger Band middle line coincides with the 0.618 Fibonacci retracement level).
Resistance levels: $5251-$5256 (upper Bollinger Band and 0.382 Fibonacci retracement level).
Key points to watch during the trading session: Whether the price can hold above the $5,200 level, and whether the US Treasury yield will break through unexpectedly.
Looking ahead to the next 2-3 days, the market will enter a period of "information digestion" and "policy implementation." Key influencing factors include:
First, alternative navigation options in the Strait of Hormuz. If the US launches naval escort operations and succeeds, the "supply cut premium" for crude oil will quickly subside; conversely, if another large ship hits a mine or is attacked, risk aversion will drive gold and crude oil prices up in tandem.
Second, the specific timetable for the IEA's release of reserves. While 400 million barrels is a large figure, the market is more concerned about the speed of delivery.
Third, the tone set by macroeconomic data. The upcoming CPI and PCE data will determine whether the US dollar can complete its shift from a safe-haven asset to one driven by interest rate differentials.
Overall, the market will maintain its characteristics of high volatility and low liquidity in the short term. Investors need to pay close attention to the touch signals of the upper and lower Bollinger Bands and be wary of the failure of technical patterns due to sudden geopolitical news.
Q1: Why did crude oil prices fall from $119 back to around $90 when the Strait of Hormuz was almost completely shut down?
A1: This is mainly driven by two factors. First, it's a correction after expectations were overdrawn. When the geopolitical situation suddenly erupted at the end of February, the market had already priced in the "worst-case scenario." Second, it's due to strong administrative intervention. The 400 million barrel release plan proposed by the well-known institution (IEA) exceeded market expectations in terms of scale, and coupled with the positive responses from major economies such as Japan and Germany, it effectively offset the panic about supply shortages. In addition, comments from the US government suggesting that the situation might be coming to an end also led some profit-taking. However, it should be noted that the current price of $90 is still about 25% higher than before the geopolitical risk erupted, indicating that the supply risk has not disappeared.
Q2: The simultaneous rise in the US dollar and US Treasury yields usually puts downward pressure on gold. Why is spot gold currently able to maintain a high level above $5,100?
A2: Gold is currently undergoing a paradigm shift from "interest rate driven" to "risk premium driven." While high interest rates increase the opportunity cost of holding gold, the situation in the Strait of Hormuz directly threatens 20% of global oil supply, triggering strong safe-haven demand. Simultaneously, inflationary expectations stemming from soaring energy prices have allowed gold to function as an inflation hedge. Technically, gold has formed strong support at the $5,000 level; this resilience has attracted more safe-haven funds, offsetting the pressure from rising US Treasury yields.
Q3: What profound impact will the attacks on non-tankers in the past 24 hours have on the crude oil market?
A3: This signifies the widespread nature of risks in the Strait of Hormuz. While attacks on oil tankers might be manageable through specific escort measures, attacks on bulk carriers and container ships in different areas indicate that the threats of electronic jamming and random projectiles are out of control. The core impact on the crude oil market lies in insurance costs. When war-risk premiums soar to $1 million per voyage and navigation systems face a 55% increase in interference, even if the Strait is physically open, businesses will proactively choose to suspend operations due to the unbalanced risk-reward ratio. This will lead to intermittent disruptions in crude oil supply, maintaining high volatility in the market.
Q4: If the IEA officially approves the plan to release 400 million barrels of oil reserves, will crude oil prices fall below $80?
A4: A break below $80 presents significant resistance. Technically, the lower Bollinger Band provides strong support around $78.40. Fundamentally, while the 400 million barrels figure is substantial, it only covers approximately 124 days of supply disruption. The market will likely view this as a non-renewable defensive measure; once inventories are depleted and the Strait of Hormuz remains closed, future supply pressures will be even greater. Therefore, the reserve release plan can suppress oil price increases in the short term, but as long as the physical blockade of the Strait of Hormuz remains in place, the bottom of the crude oil price range will be difficult to lower significantly due to increased production and logistics costs.
Q5: How do you understand the contradictory phenomenon of the coexistence of "W-shaped rebound" and "MACD death cross" in the current technical chart?
A5: This reflects a rapid shift in bullish and bearish momentum. The MACD death cross reflects the inertial momentum after the drop from the high of $119, representing a digestion of the previous extreme market conditions. The W-shaped rebound, however, appears in shorter-term candlestick patterns, indicating strong bargain-hunting activity in the $5000-$5100 range (gold) or the $80-$85 range (crude oil). This contradiction usually indicates that the market has entered a period of consolidation and bottoming. Whether the candlestick can hold above the Bollinger Band's middle line in the next 2-3 days will be crucial. If it holds, the W-shaped bottom is confirmed; if it encounters resistance and falls back, the MACD death cross may initiate a second round of downward movement.
News Logic Connection: The Game Between the Cross-Strait "Vacuum Period" and Policy Intervention
The situation over the past 24 hours has shown a high degree of logical coherence, with the core issue being the struggle between the confirmation of physical blockade and official measures to quell the unrest.
1. Persistent Physical Supply Disruptions <br/>According to the latest monitoring, although the White House denied previous claims that the US military was escorting oil tankers through the Strait of Hormuz, the market has clearly perceived the current physical isolation of the Strait of Hormuz. In the past day, only one commercial vessel confirmed passage through the area, a daily traffic volume that has plummeted by 86% compared to the 2026 average. More threateningly, three ship damage incidents occurred in the past 24 hours (including Japanese and Marshall Islands-flagged bulk carriers). Although not targeting oil tankers, these incidents significantly increased the war risk premium, causing insurance costs per voyage to soar to $500,000 to $1 million. This "de facto blockade" has prompted energy giants such as Saudi Aramco to warn that if the disruption continues, the current five-year low in global inventories will have catastrophic consequences.
2. Hedging the Largest Reserve Release Plan in History <br />In response to the aforementioned supply disruptions, the International Oil Agency (IEA) has proposed releasing 400 million barrels of strategic petroleum reserves, more than double the amount released during the Russia-Ukraine conflict in 2022. This move aims to hedge against geopolitical premiums through administrative intervention. Currently, Germany and Japan have expressed a strong willingness to cooperate, with Japan planning to begin releasing reserves as early as March 16th. This policy is expected to effectively curb the extreme upward momentum of Brent crude oil towards $120 in the past 12 hours, but it has also triggered deep concerns in the market about insufficient "reserve ammunition."
3. The Link Between Inflation Expectations and Monetary Policy <br />Geopolitical conflicts driving up energy prices have already spilled over into the bond market. The market widely expects the upcoming US February CPI data to exceed expectations due to higher gasoline costs, directly weakening market bets on interest rate cuts. European Central Bank officials have even signaled a hawkish stance on an earlier rate hike. This expectation of "high inflation + high interest rates" has not only boosted the US dollar index but also kept the 10-year US Treasury yield above 4.1%, putting technical pressure on gold. However, the spillover safe-haven demand has provided support.
Asset Trend Analysis: Technical Indicators and Key Range Forecasts
Based on market movements and technical charts over the past 24 hours, the following is an analysis of the trends of the three core assets over the next 2-3 days.
Brent Crude Oil: Consolidation After Dramatic Volatility <br/>Technical Analysis: The 240-minute chart shows that Brent crude oil, after retreating from its extreme high of $119.45, is currently fluctuating around $91.03. The MACD death cross has not completely dissipated, indicating that the bearish momentum remains, but the price action is closely following the Bollinger Band's middle line, reflecting the market's need for portfolio adjustments after the $28 plunge.
Logical support: Although the IEA's release of reserves dampened speculative bullish sentiment, the zero-passage status of the Strait of Hormuz provided strong physical support.
Support and resistance levels: Support below: $78.40 (lower Bollinger Band) to the $80.00 psychological level.
Resistance levels: $93.51 (Bollinger Band middle line) and the densely traded area at $98.00.
Key points to watch during trading hours: Whether IEA member countries will formally approve the 400 million barrel release plan on Wednesday, and whether there will be any new escort operations in the Strait of Hormuz.
US Dollar Index and US Treasuries: High-Level Consolidation Amidst Strong Coordination <br/>Technical Analysis: The US Dollar Index is currently around 98.98, closely following the Bollinger Band's middle line (99.02). The MACD green histogram is narrowing slightly, indicating weakening downward momentum and a stronger rebound intention. The 10-year US Treasury yield has broken through the middle line and is approaching the upper line at 4.20%, showing a relatively strong trend.
Logical support: Safe-haven flows and bets against inflation are the main drivers of the US dollar's performance. Due to instability in the Taiwan Strait, the risk of energy inflation has significantly increased the probability that the Federal Reserve will remain on hold.
Support and resistance levels: Support levels below: 98.40 (US Dollar Index), 4.14% (US Treasury Yield).
Resistance levels: 99.69 (recent high of the US dollar index), 4.21% (high of US Treasury yields).
Key focus during trading: Tonight's US CPI data. If the figure is high, it will directly drive the US dollar to rise again.
Spot Gold: Defensive Counterattack from a W-Shaped Bottom <br/>Technical Analysis: Gold is currently priced at $5182.70 per ounce. The MACD shows a golden cross, and the red momentum bars continue to expand, indicating that the bulls have regained the initiative after a significant pullback. The candlestick pattern has formed a solid W-shaped rebound structure above $5100.
Logical support: Gold is currently caught in a struggle between "high interest rate pressure" and "safe-haven buying support." Recent energy price volatility and stagflation concerns have significantly increased its attractiveness as a risk-hedging asset.
Support and resistance range: Support below: $5155-$5157 (the area where the Bollinger Band middle line coincides with the 0.618 Fibonacci retracement level).
Resistance levels: $5251-$5256 (upper Bollinger Band and 0.382 Fibonacci retracement level).
Key points to watch during the trading session: Whether the price can hold above the $5,200 level, and whether the US Treasury yield will break through unexpectedly.
Trend Outlook: Key Trigger Points in the Next 72 Hours
Looking ahead to the next 2-3 days, the market will enter a period of "information digestion" and "policy implementation." Key influencing factors include:
First, alternative navigation options in the Strait of Hormuz. If the US launches naval escort operations and succeeds, the "supply cut premium" for crude oil will quickly subside; conversely, if another large ship hits a mine or is attacked, risk aversion will drive gold and crude oil prices up in tandem.
Second, the specific timetable for the IEA's release of reserves. While 400 million barrels is a large figure, the market is more concerned about the speed of delivery.
Third, the tone set by macroeconomic data. The upcoming CPI and PCE data will determine whether the US dollar can complete its shift from a safe-haven asset to one driven by interest rate differentials.
Overall, the market will maintain its characteristics of high volatility and low liquidity in the short term. Investors need to pay close attention to the touch signals of the upper and lower Bollinger Bands and be wary of the failure of technical patterns due to sudden geopolitical news.
Frequently Asked Questions
Q1: Why did crude oil prices fall from $119 back to around $90 when the Strait of Hormuz was almost completely shut down?
A1: This is mainly driven by two factors. First, it's a correction after expectations were overdrawn. When the geopolitical situation suddenly erupted at the end of February, the market had already priced in the "worst-case scenario." Second, it's due to strong administrative intervention. The 400 million barrel release plan proposed by the well-known institution (IEA) exceeded market expectations in terms of scale, and coupled with the positive responses from major economies such as Japan and Germany, it effectively offset the panic about supply shortages. In addition, comments from the US government suggesting that the situation might be coming to an end also led some profit-taking. However, it should be noted that the current price of $90 is still about 25% higher than before the geopolitical risk erupted, indicating that the supply risk has not disappeared.
Q2: The simultaneous rise in the US dollar and US Treasury yields usually puts downward pressure on gold. Why is spot gold currently able to maintain a high level above $5,100?
A2: Gold is currently undergoing a paradigm shift from "interest rate driven" to "risk premium driven." While high interest rates increase the opportunity cost of holding gold, the situation in the Strait of Hormuz directly threatens 20% of global oil supply, triggering strong safe-haven demand. Simultaneously, inflationary expectations stemming from soaring energy prices have allowed gold to function as an inflation hedge. Technically, gold has formed strong support at the $5,000 level; this resilience has attracted more safe-haven funds, offsetting the pressure from rising US Treasury yields.
Q3: What profound impact will the attacks on non-tankers in the past 24 hours have on the crude oil market?
A3: This signifies the widespread nature of risks in the Strait of Hormuz. While attacks on oil tankers might be manageable through specific escort measures, attacks on bulk carriers and container ships in different areas indicate that the threats of electronic jamming and random projectiles are out of control. The core impact on the crude oil market lies in insurance costs. When war-risk premiums soar to $1 million per voyage and navigation systems face a 55% increase in interference, even if the Strait is physically open, businesses will proactively choose to suspend operations due to the unbalanced risk-reward ratio. This will lead to intermittent disruptions in crude oil supply, maintaining high volatility in the market.
Q4: If the IEA officially approves the plan to release 400 million barrels of oil reserves, will crude oil prices fall below $80?
A4: A break below $80 presents significant resistance. Technically, the lower Bollinger Band provides strong support around $78.40. Fundamentally, while the 400 million barrels figure is substantial, it only covers approximately 124 days of supply disruption. The market will likely view this as a non-renewable defensive measure; once inventories are depleted and the Strait of Hormuz remains closed, future supply pressures will be even greater. Therefore, the reserve release plan can suppress oil price increases in the short term, but as long as the physical blockade of the Strait of Hormuz remains in place, the bottom of the crude oil price range will be difficult to lower significantly due to increased production and logistics costs.
Q5: How do you understand the contradictory phenomenon of the coexistence of "W-shaped rebound" and "MACD death cross" in the current technical chart?
A5: This reflects a rapid shift in bullish and bearish momentum. The MACD death cross reflects the inertial momentum after the drop from the high of $119, representing a digestion of the previous extreme market conditions. The W-shaped rebound, however, appears in shorter-term candlestick patterns, indicating strong bargain-hunting activity in the $5000-$5100 range (gold) or the $80-$85 range (crude oil). This contradiction usually indicates that the market has entered a period of consolidation and bottoming. Whether the candlestick can hold above the Bollinger Band's middle line in the next 2-3 days will be crucial. If it holds, the W-shaped bottom is confirmed; if it encounters resistance and falls back, the MACD death cross may initiate a second round of downward movement.
- Risk Warning and Disclaimer
- The market involves risk, and trading may not be suitable for all investors. This article is for reference only and does not constitute personal investment advice, nor does it take into account certain users’ specific investment objectives, financial situation, or other needs. Any investment decisions made based on this information are at your own risk.